About
Gallery analytics provide in-depth insights into user engagement, geographical location, and viewing methods, allowing you to optimize your content strategy.
The intuitive dashboard offers easy exploration of data over different time periods, with comprehensive filtering options for specific analysis. Stay up-to-date with real-time data, and take action based on actionable insights.
In Kaltura, a gallery is a type of category, so the dashboard uses the term "category" throughout.
To learn how to work with the gallery analytics dashboard, check out our article Working with the gallery analytics dashboard.
Privacy or ad-blocking software may cause potential issues when collecting Kaltura analytics. To address this, try allowing Kaltura domains and removing Kaltura-related sites from your firewall settings or filters.
Who can use this
- Gallery owners
- Gallery managers
Access gallery analytics
1. From the top navigation bar, select the gallery.

The gallery page opens.

2. At the far right, click the Actions menu and select Analytics.

The gallery analytics dashboard displays. To return to the gallery, click Back to Gallery at the top of the page.

Dashboard overview
The dashboard enables you to explore the activity in a specific gallery / category, track usage over time, compare periods, and apply filters such as tags and media type.
As a reference for analytics terms and definitions, please see the Analytics Terminology article.
The top panel of the dashboard provides an overview with details, highlights and insights for the gallery / category.
To change the time period or filter any of the data, use the date picker and Filter menu at the top of the dashboard. You can also export the data from the Export menu. For more information, see Working with the category analytics dashboard.
Below these controls, you can see the category's details: parent category, category ID, number of sub-categories, creation date, and the date of the last update.

Highlights
The Highlights section displays a snapshot of the important metrics for the selected timeframe. You can see:
- Player Impressions - How many times the video was loaded on the page, regardless of whether the user clicked Play or not.
- Plays - Number of times the Play button was pressed, and the number of entries that were played.
- Unique Viewers - Number of unique users that had an active viewing action during the time period. Note that Player Impressions are not counted as a viewing action.
- Minutes Viewed - Minutes played across all viewers.
- Contributors - Users who created content.
Click See Details to jump to the Category Performance Over Time graph with all the metrics for the selected time frame.
Category page views
This section displays the views from the Category Page (including category pages that have secure embed enabled). It compares the plays and unique viewers from the category page with all plays and unique viewers.
Plays outside the context of the category may come from links or embed codes that were shared. This analytic is relevant to applications only. See our article Category Page Views for more information.
Top videos
The top videos are selected based on a unique algorithm that takes into consideration parameters such as the amount of plays, unique viewers, and average completion rate and scores them in comparison to other videos in the account.
Click See Details to display the Top Videos panel.
Top viewers
Top Viewers displays the users sorted by number of plays. Click See Details to open the Users metrics.
Insights
Under Insights, you can find snapshots of information about the user's habits, such as what websites they usually watch videos on and their favorite tools for viewing, as well as where the user is located.
Use the dots below the panel to move between the insights.
Most Viewed Domain - Click See Details to jump to the metrics for Top Domains.
Most Popular Device - Click See Details to jump to the metrics for Devices Overview.
Top Locations - Click See Details to jump to the metrics for Top Countries.
Category performance over time
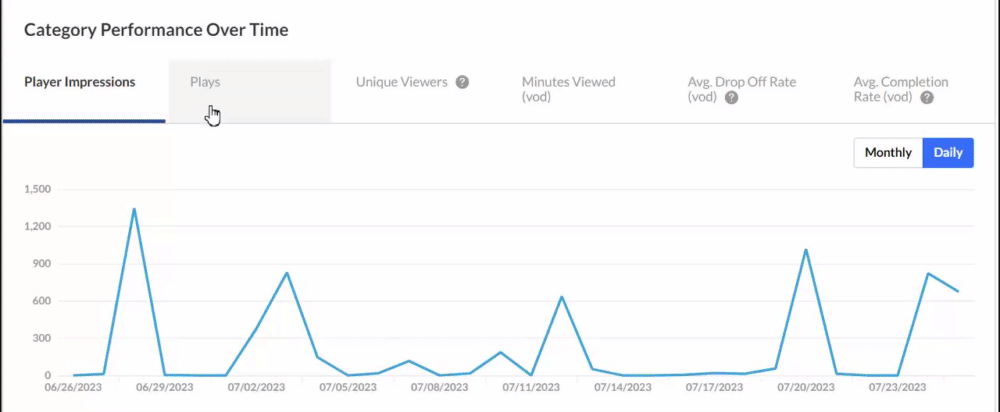
In this graph you can see:
- Player Impressions (default) - A player impression event is counted each time the player is loaded on the page.
- Plays - A play is counted when a user clicks the Play button to watch a video. If the player is set to auto-play, a play event will be counted when the player begins to play the video.
- Unique Viewers - Number of Unique Users that had an active viewing action during the time period. Note that Player Impressions are not counted as a viewing action.
- Minutes Viewed - Total number of playback minutes played by the viewers, based on quartile milestones. Example: If a user watched 4 minutes from a 10-minute video it will be calculated as 2.5 minutes (25% milestone).
- Avg. Completion Rate (vod) - Average percentage of completion, across all plays. Example: If a user once watched 20% of the video and the second time watched 80% of the video, the calculation will be: (20+80)/2 plays = 50% Avg. Completion Rate.
You can view the metrics on either a monthly or daily basis by selecting the option on the far right of the panel.
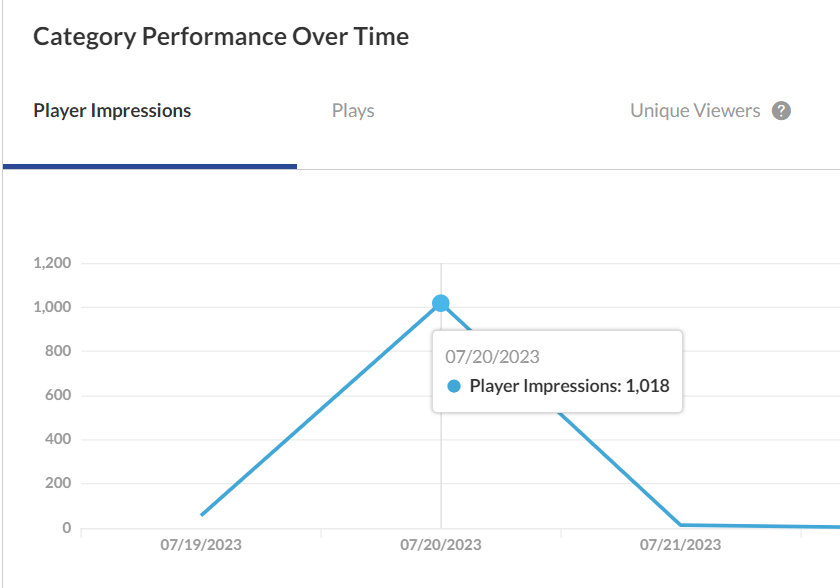
Hover over any point in the graph to see the detailed data.
Click View Details at the bottom of the graph to display and expand the graph for the various metrics available.

Users
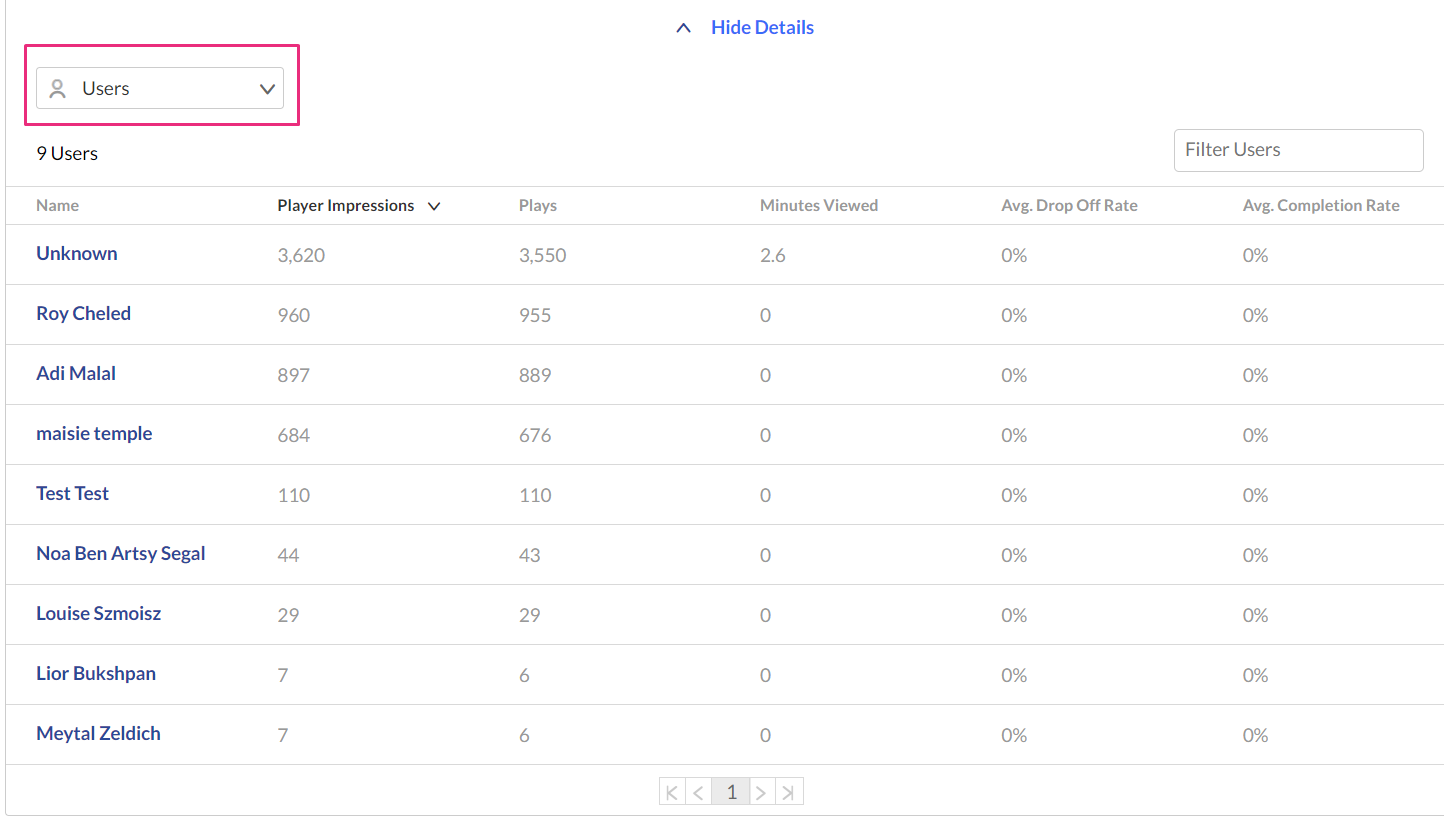
Select Users from the dropdown. A list of Users and their metrics displays.
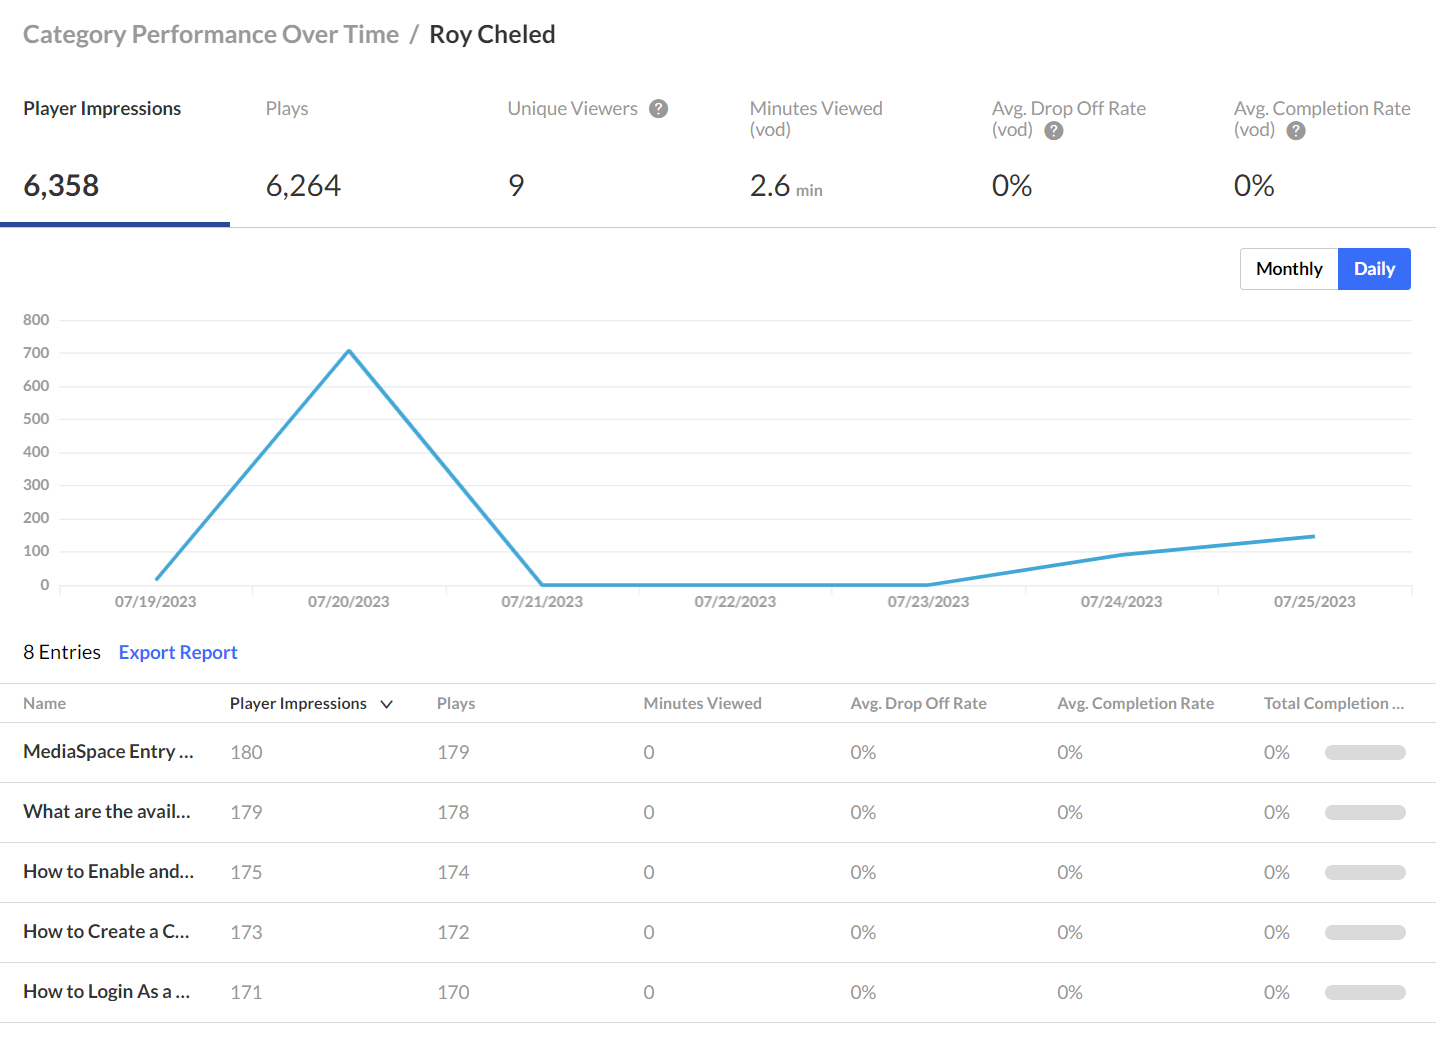
Click on a user to see the metrics for the selected user.
Dates
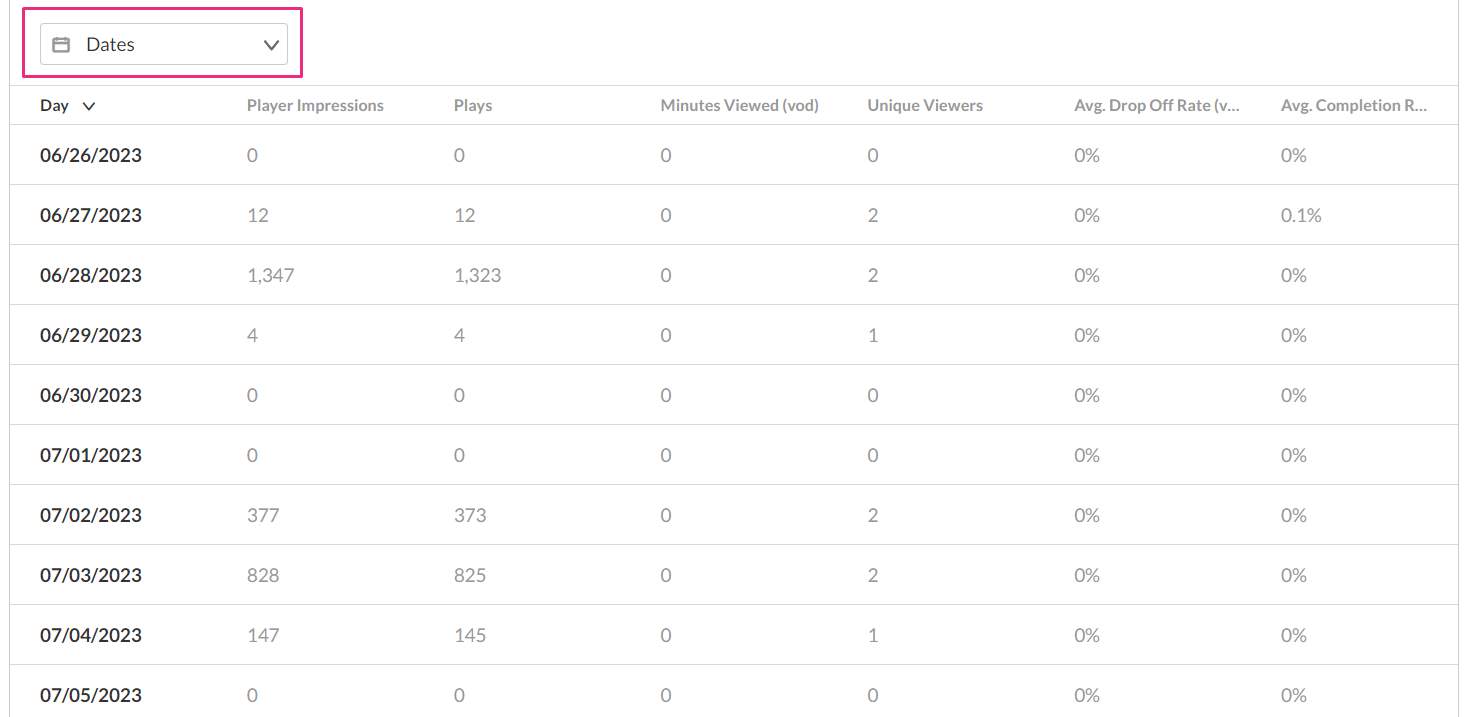
You can view the data for each metric in daily or monthly granularity. Hover over any point in the graph to see the detailed data. You can also compare to another metric by selecting another metric from the drop-down list.
To change the time period or filter the data, use the date picker and filter panel at the top of the dashboard. You can also compare data from different time periods.
Top videos
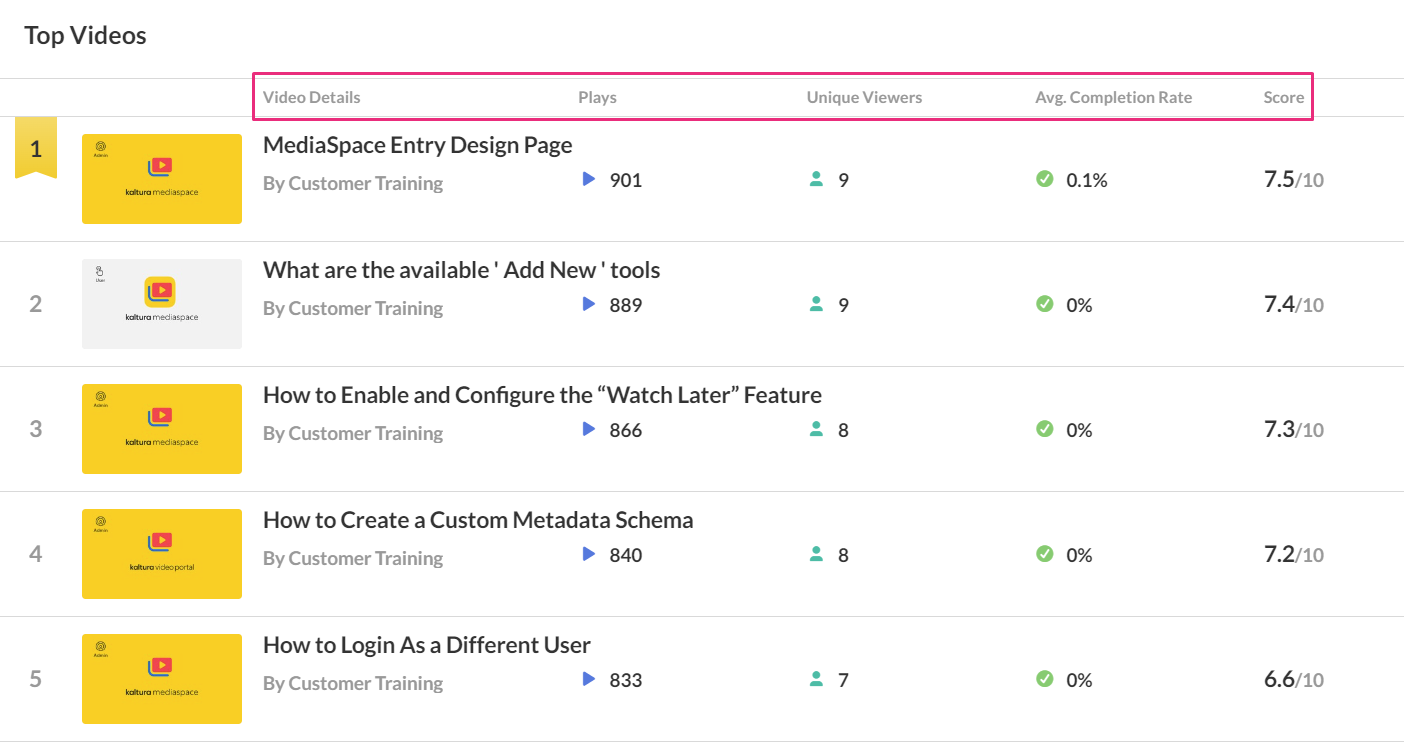
The Top Videos data is filtered on content from the category and its sub-categories. In this panel, you can see the following information for each video:
- Video Details - You can click on the video name to display a dropdown with more information about that video.
- Plays - A play is counted when a user clicks the Play button to watch a video. If the player is set to auto-play, a play event will be counted when the player begins to play the video.
- Unique Viewers - Number of Unique Users that had an active viewing action during the time period. Note that Player Impressions are not counted as a viewing action.
- Avg. Completion Rate - Average percentage of completion, across all plays. Example: If a user once watched 20% of the video and the second time watched 80% of the video, the calculation will be:(20+80)/2 plays = 50% Avg. Completion Rate.
- Score - You can see how successful the video has been in comparison to other videos in the account.
Top countries
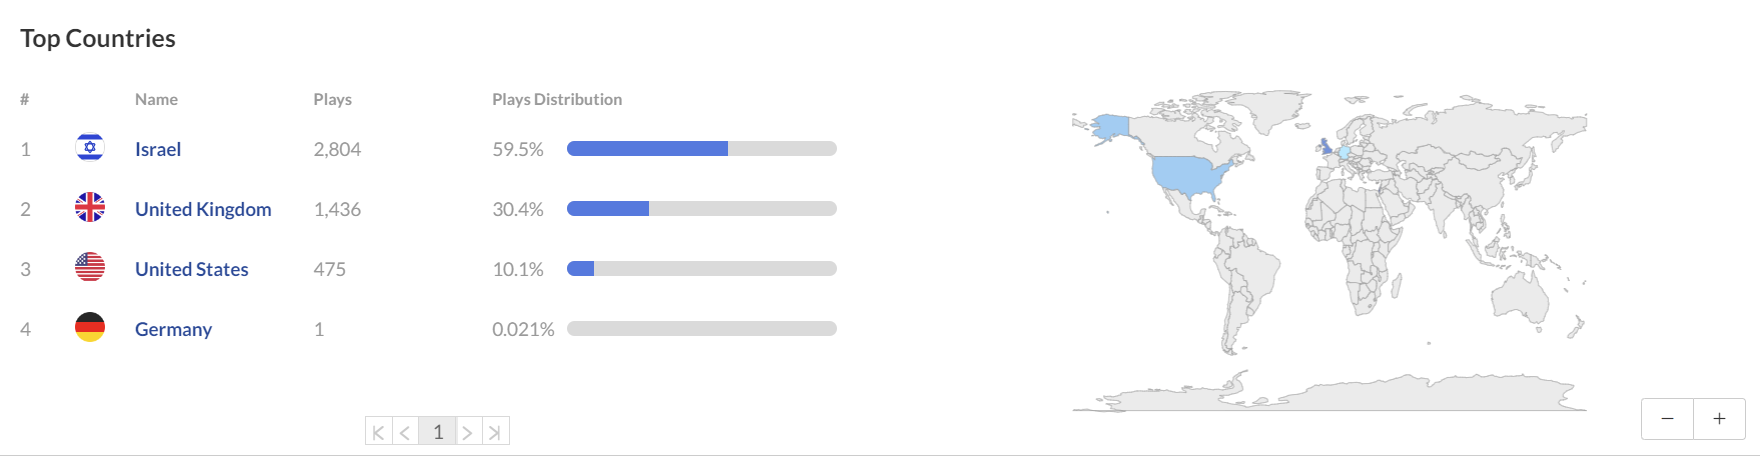
The Top Countries panel ranks the geographical distribution by plays. The heatmap shows the countries; the darker the shade, the more plays for that country. For each country the following metrics are available:
- Plays - A play is counted when a user clicks the Play button to watch a video. If the player is set to auto-play, a play event will be counted when the player begins to play the video.
- Plays Distribution - Number of plays divided by the total number of plays in the selected timeframe.
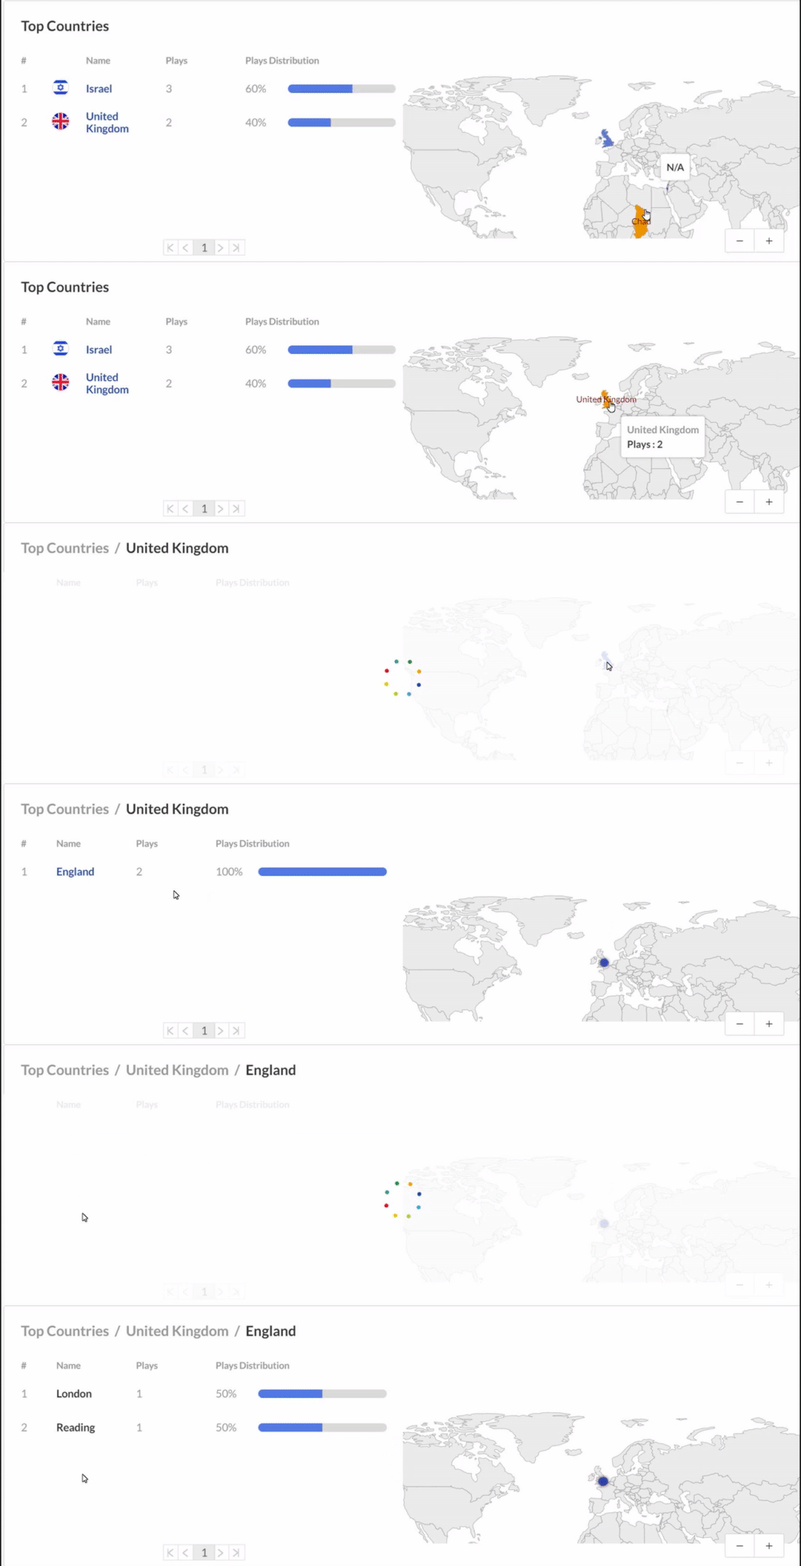
You can drill down to region by selecting a country on the map, then select a region to drill down to cities.
Devices overview
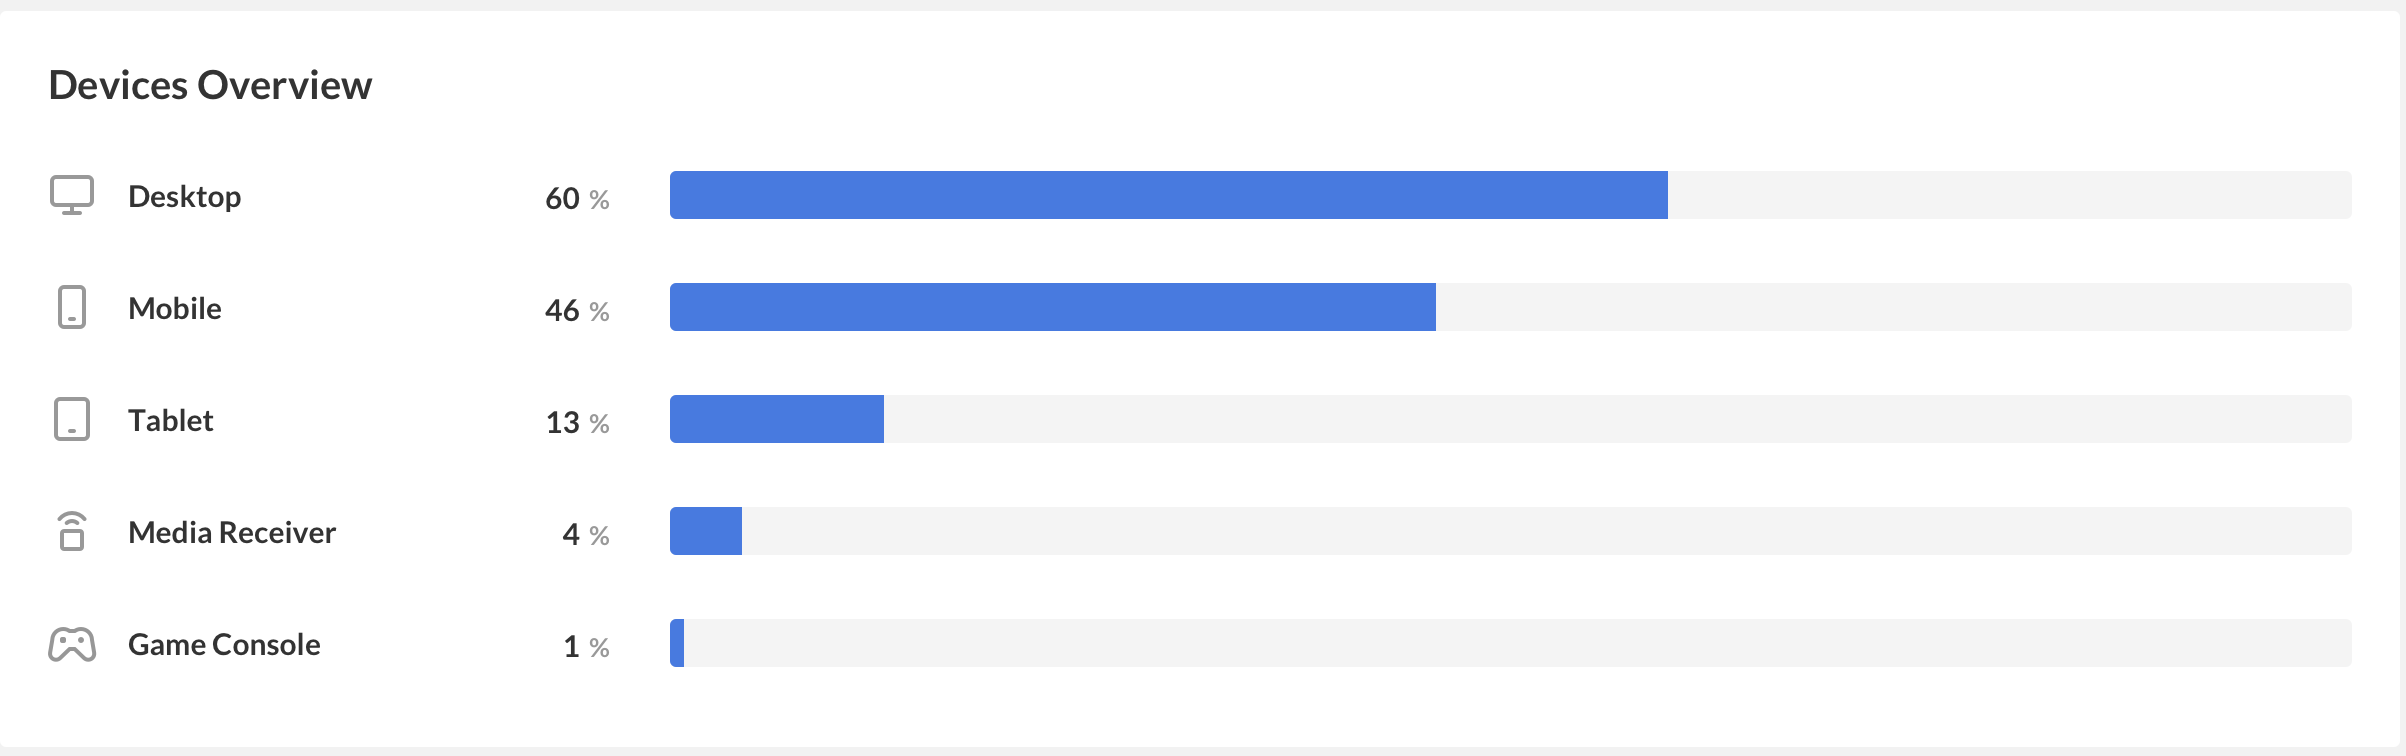
In this panel, the Devices Overview graph displays the distribution of devices usage by plays. You can see on which device viewers watched the entry.
Top domains
In this panel, the top domains are ranked by the domains that had the most plays in the selected time frame. For each domain the following metrics are available:
- Player impressions - A player impression event is counted each time the player is loaded on the page.
- Player impression ratio - The number of plays divided by number of impressions.
- Plays - A play is counted when a user clicks the Play button to watch a video. If the player is set to auto-play, a play event will be counted when the player begins to play the video.
- Plays Distribution - Number of plays divided by the total number of plays in the selected timeframe.
- Minutes Viewed (VOD) - Total number of playback minutes played by the viewers, based on quartile milestones. Example: If a user watched 4 minutes from a 10-minute video it will be calculated as 2.5 minutes (25% milestone).
- Average completion rate (VOD) - Average percentage of completion, across all plays. Example: If a user once watched 20% of the video and the second time watched 80% of the video, the calculation will be: (20+80)/2 plays = 50% Avg. Completion Rate.

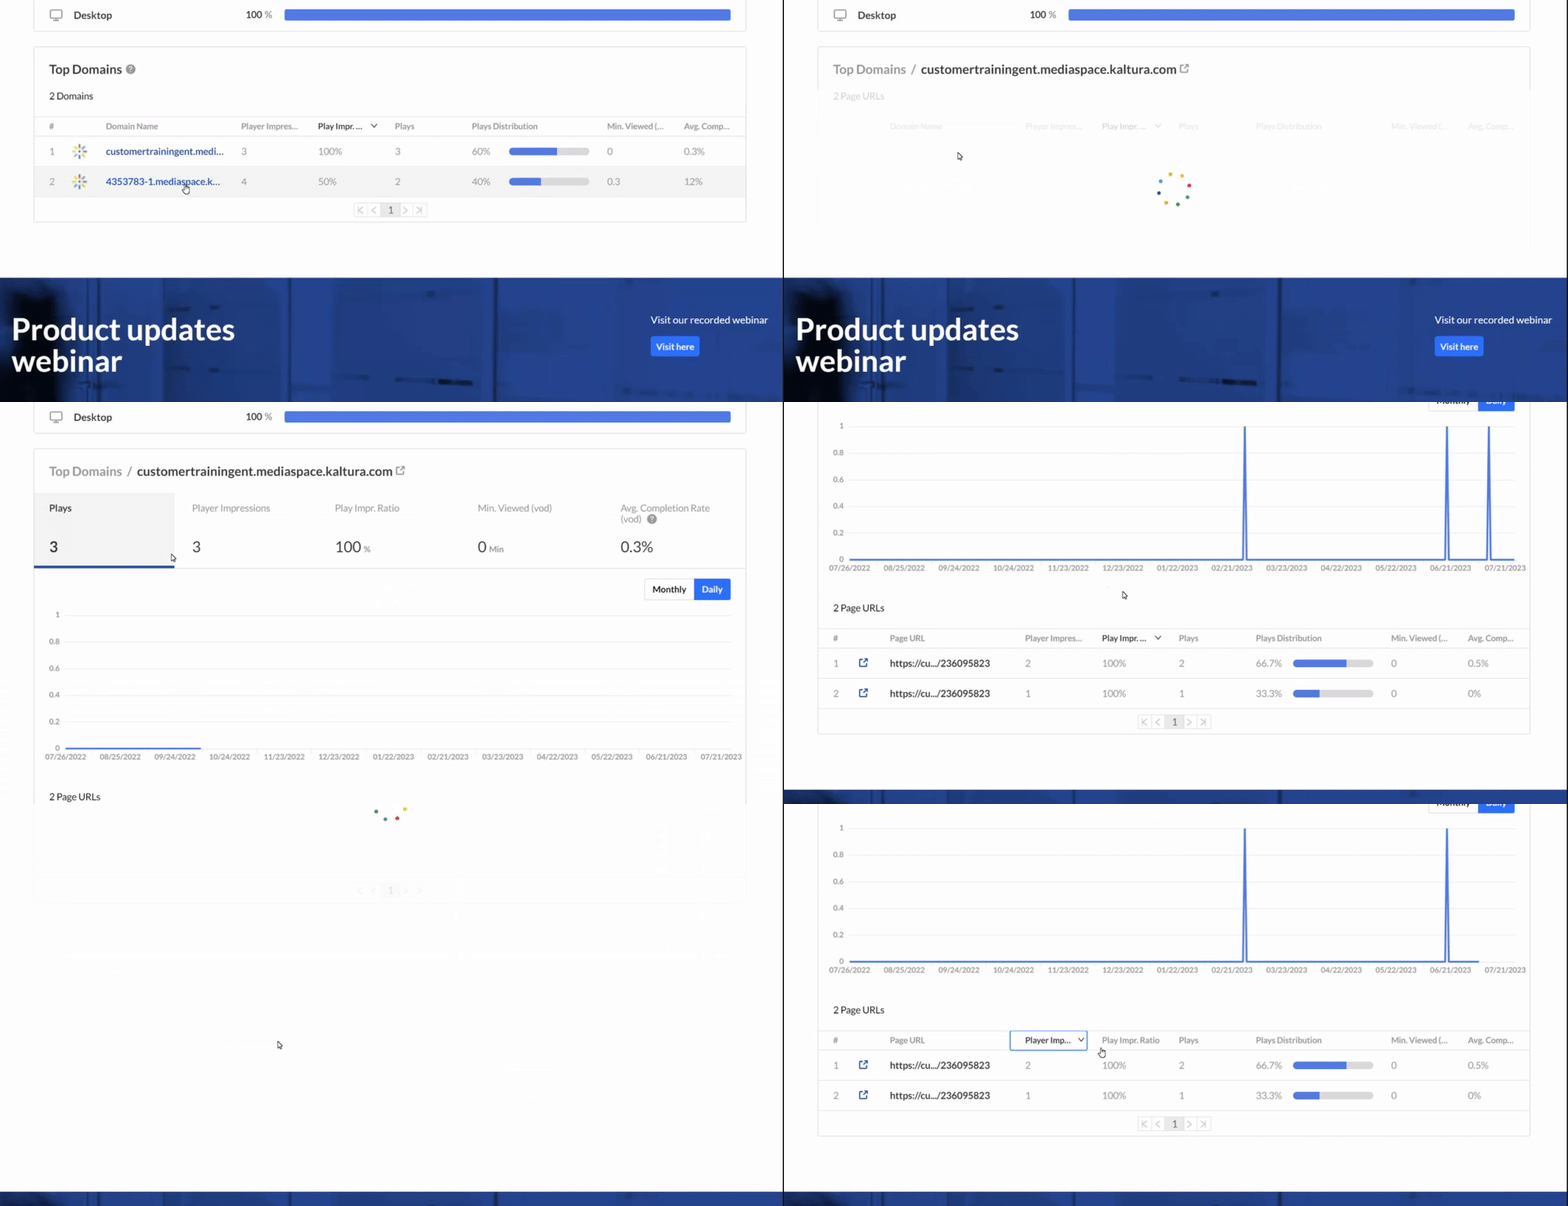
You can also drill down to a specific domain to see all the URLs under that domain and the same metrics in a more granular view.
You can view the data for each metric in daily or monthly granularity. Hover over any point in the graph to see the detailed data. Click on the title of the metric in the table to sort the table based on this metric.