This article clarifies the terminology used in the Kaltura analytics.
Some viewer metrics, such as Unique Viewers and Active Users, are estimated. Anonymous users are counted as one. Dashboard values may differ slightly (~2%) from exported reports due to calculation differences.
| Metric name | System name | Definition | Notes |
| Accumulative Storage | aggregated_monthly_avg_storage | The sum of the monthly avg. storage of all months in the given timeframe. |
|
| Active Users | view_unique_audience | An estimated real-time count of unique authenticated viewers currently watching the broadcast. All anonymous viewers are counted as one. May differ slightly (by ~2%) from totals in exported reports. | Appears in the Real-Time dashboard. |
| Avg. Completion Rate (VOD) | avg_completion_rate | Average percentage of completion, across all plays. Calculated for VOD only.
Example: If a user once watched 20% of the video and the second time watched 80% of the video, the calculation will be: (20+80)/2 plays = 50% Avg. Completion Rate. |
Calculated for VOD entries only.
This metric is NOT calculated based on quartiles. This metric can be found in the following dashboards:
|
| Avg.Drop off Rate (VOD) | avg_view_drop_off | The average percentage of drop-off quartile (last quartile watched), across all plays. Calculated for VOD entries only.
Example: If a user once watched 20% of the video and the second time watched 80% of the video, the calculation will be: (0+75)/2 plays = 37.5% Avg. Drop Off Rate. 20% is calculated as 0 since the user didn’t reach the 25% milestone and 80% is calculated as 75% as the user passed the 3rd quartile milestone. |
Calculated for VOD entries only. This metric is calculated based on quartiles. |
| Avg. Latency Rate | avg_view_live_latency | Indicates the avg. of all users’ seconds view latency in the time that the stream is broadcasting compared to the latency in the view. | Appears in Real-Time dashboard. |
| Avg. Bitrate | avg_view_bitrate | Indicates the quality of the video watched. Kaltura Player sends a beacon every 10 seconds with the viewed bitrate. The average bitrate is the average reported bitrate across all players (sum of bitrate /number of view events with reported bitrate). | Appears in the Real-Time and Session/Webcast Entry dashboards. |
| Avg. Buffer Rate | view_buffer_time_ratio / avg_live_buffer_time | From the total amount of time viewed, the percent of time the player was buffering. | Appears in the Real-Time and Session/Webcast Entry dashboards. |
| Avg. Live Engagement Rate, Avg. Engagement | live_engaged_users_play_
time_ratio |
The average percentage of total view time of unique viewers that have both the tab in focus and the sound on for the session, from the total viewed time for all unique viewers. | Appears in the Session/Webcast Entry / Real-Time dashboards. |
| Avg. Min Viewed | N/A | The average of minutes viewed per play (total minutes viewed/total plays). | Appears in the Technology dashboard. |
| Avg. View Time (User Dashboard) | avg_time_viewed | The average of minutes viewed by the user, calculated by quartile, per play. | For VOD only. Appears in the User entry dashboard. This metric is calculated based on quartiles. |
| Bandwidth and Accumulative Storage | combined_bandwidth_
aggregated_storage |
The sum of accumulative storage + bandwidth consumption for the given timeframe. |
|
| Combined Bandwidth and Consumption | combined_bandwidth_
storage |
The sum of the average storage and bandwidth consumption. |
|
| Downstream Bandwidth | N/A | Sum of downloaded video segments size / time to download video segments. | Appears in the Real-Time dashboard. |
| Dropped Frame Rate | avg_view_dropped_frames_ratio | The average percentage of number of frames that weren't rendered. (Sum of reported dropped frames/number of view events that had a reported dropped frame.) | Appears in the Real-Time dashboard. |
| DVR Users | view_unique_audience_dvr | Number of Unique Users viewing content within the DVR window. (DVR includes the option to seek backwards and forward in the player during the live/simulive broadcast.) | Appears in the Real-Time dashboard. |
| Engaged Users | live_engaged_users_ratio | The real-time estimated percentage of active users who have both the tab in focus and audio on during a live session. Based on real-time player data and may differ slightly (by ~2%) from values in exported reports. | Appears in the Real-Time dashboard. |
| Ending Time | N/A | The time when the broadcast ended. | Appears in the Real-Time dashboard. |
| Known Viewers | unique_viewers | Number of Unique Users that had an active viewing action, and are either authenticated or registered (i.e. not anonymous viewers).
Note that Player Impressions are not counted as a viewing action. |
Appears in the Session/Webcast Entry dashboard. |
| Minutes Viewed | sum_view_period | Minutes played across all viewers. | This metric is NOT calculated based on quartiles.
It can be found in the following dashboards:
|
| Minutes Viewed (VOD) | sum_time_viewed | Total number of playback minutes played by the viewers, based on quartile milestones. Calculated for VOD entries only.
Example: If a user watched 4 minutes from a 10-minute video it will be calculated as 2.5 minutes (25% milestone). |
Calculated for VOD entries only. This metric is calculated based on quartiles. It can be found in the following dashboards:
|
| Peak Users | viewers | Highest number of users within a session. | Appears in the Real-Time dashboard. |
| Playback Context | N/A | Playback context shows where viewers accessed your content, such as the specific channel or gallery on your site. Entries played outside known playback contexts are marked as "Unknown". |
|
| Played Entries | N/A | Video entries with at least one play event associated with them. |
|
| Player Impression | count_loads | A player impression event is counted each time the player is loaded on the page. | |
| Player Impression Ratio | load_play_ratio | The number of plays divided by number of impressions. |
|
| Plays | count_plays | A play is counted when a user clicks the Play button to watch a video. If the player is set to auto-play, a play event will be counted when the player begins to play the video. | Pausing and resuming is not counted as additional Play events. |
| Plays Distribution | N/A | Number of plays divided by the total number of plays in the selected timeframe. |
|
| Top Served Flavor | N/A | Indicates the flavor that is mostly viewed in the broadcast being viewed. The transcoding profile is defined in the Rich Media CMS. | With ABR playback, the viewed flavor changes based on the user’s network conditions and device used. Appears in Real-Time dashboard. |
| Top Video Score | N/A | Video Score is calculated by a proprietary formula, taking into account multiple parameters such as unique viewers, plays and avg. completion rate. | |
| Total Completion Rate (VOD) | total_completion_rate | Total percentage of the associated VOD watched per user, accumulated across all play sessions, excluding repetitions. For example: If the VOD is an hour and the user watched the first 20 minutes the first time and watched the first 30 minutes the second time, the total completion rate will be 50%. | Calculated for VOD entries only. This metric can be found in the following dashboards:
|
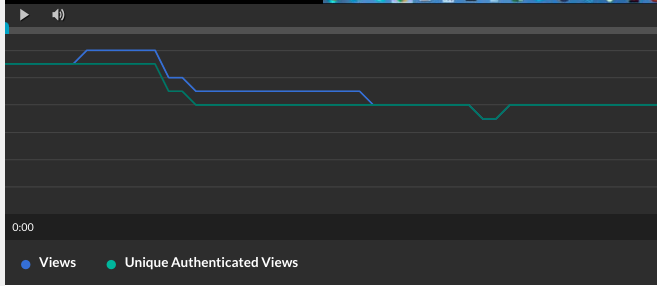
| Unique Authenticated Views | N/A | For a certain frame in the video how many unique views for all users.
Users can view the same time frame several times and be counted as one unique view. |
Appears in VOD Entry dashboard - “Views vs. Unique Authenticated Views by time” graph.
The number appears when hovering the graph on a specific time frame. |
| Unique Viewers | N/A | Unique Viewers = Unique User IDs.
An estimated count of unique authenticated viewers who had an active viewing action during the selected time period. All unauthenticated or anonymous users are counted as one. Values may differ slightly (by ~2%) from exported reports due to differences in calculation methods. |
Player Impressions are not counted as a viewing action. |
| Views | N/A | For a certain time frame in the video, the number of total views across all users. | Appears in VOD Entry dashboard - “Views vs. Unique Authenticated Views by time” graph.
The number appears when hovering the graph on a specific time frame. |
What is the difference between participated versus attended in a session user activity?
Participated = registered, Attended = logged in
Entry-level analytics terminology
Definitions for Views, Unique Authenticated Views, and Viewers differ when displaying analytics at Entry Level.
Views: The number of users that press play and their viewership throughout the entry. The graphical user interface (below) displays how many users view each minute of the entry.
Unique Authenticated Views: equivalent to views, but counted once.
Users: Users who have either "played" or "viewed" the media. 
