About
The Chat and Collaboration (C&C) widget is an engagement panel that gives moderators and hosts a central place to connect with participants, manage session activity, and encourage interaction in Kaltura Rooms and live webcasts.
You can open and manage the engagement panel during a live session, and configure its default settings in advance via the media edit page.
Moderators can manage the C&C widget per session via the media edit page (Chat tab), tailoring the experience to meet specific needs. Check out our article Configure chat settings for Kaltura Room for details.
Open the widget
Click the arrow icon in the upper right corner to open the engagement panel.

What’s in the widget?
The C&C widget includes several tabs, each designed to help you interact with attendees and manage the session more effectively:
Interactions tab
Launch polls, quizzes, word clouds, and other interactive tools to drive engagement.

See our article Interaction tools for moderators for more information.
Updates tab
Send real-time announcements to all attendees. These appear in the Updates tab and briefly as popups during the session.

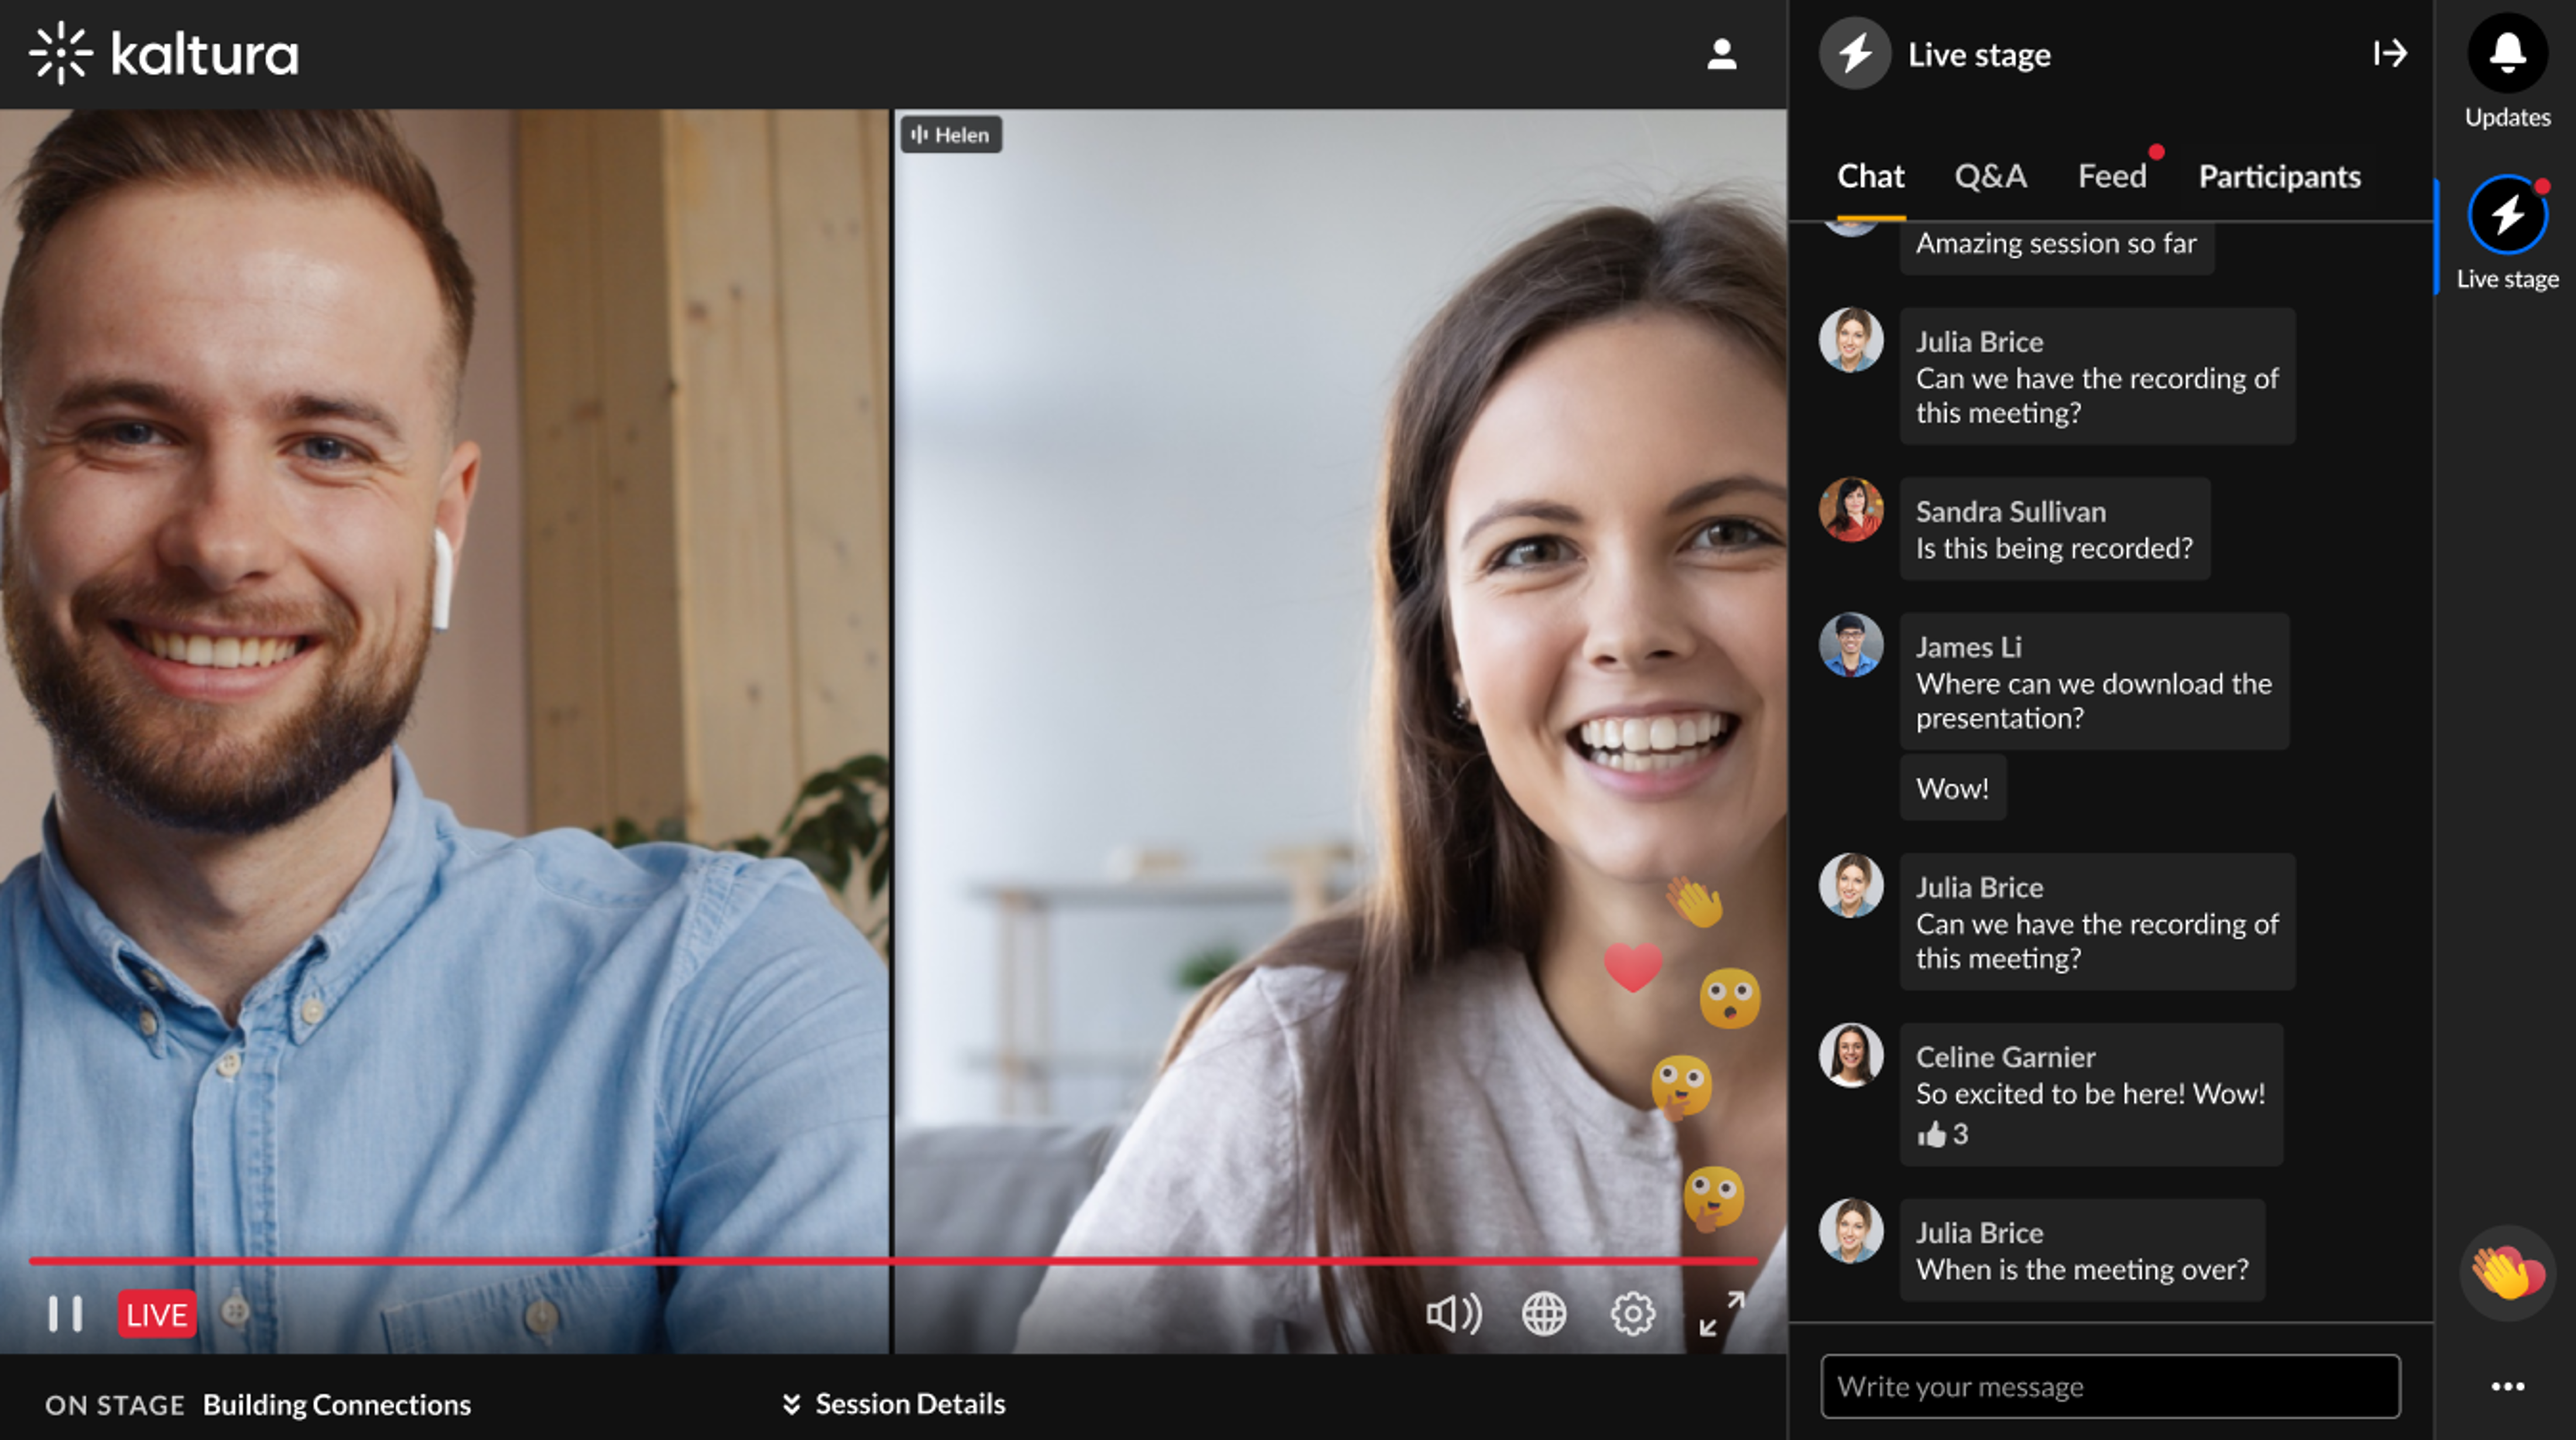
Live Stage tab
Use this tab to manage session-level engagement. It includes sub-tabs for Chat, Q&A, Feed, Backchannel, and Participants.
Chat is fully supported in 12 languages.

See our article Live stage management tools for more information.
Settings
Each user can access their personal settings by clicking the three-dot menu at the bottom of the engagement panel.

Toggle on the desired item to enable it.
- Allow toast notification - for updates like new polls or direct messages
- Show my last name - display full name in the session
Reactions
Click on the Reactions icon (clapping hands emoji) and choose the emoji you want.

Your selected reaction displays briefly to everyone in the session.