About
What is a web debugging tool?
A web debugging tool is a proxy (HTTP Proxy / HTTP Monitor) that runs on your computer. Your browser (or any Internet-connected app) is configured to connect through this proxy, allowing the tool to record and display network traffic.
Kaltura recommends:
- Fiddler for Windows
- Charles Proxy for Mac
When should you capture traffic logs?
Traffic logs capture the communication between your browser and Kaltura’s servers. They help Kaltura Support identify the root cause of issues that are specific to your environment or hard to reproduce.
You can capture logs using either your browser’s built-in developer tools or a dedicated proxy tool such as Fiddler or Charles.
Google Chrome dev tools
Preserve logs
Preserve logs keeps logs between page refreshes - useful when debugging issues that require reloading.
To preserve the logs
- Press F12 (or right click on the page and select Inspect).
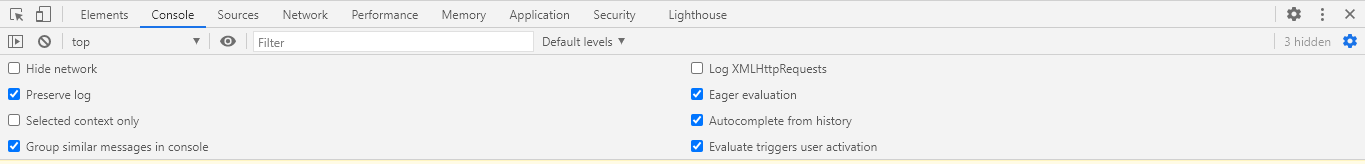
- At the top-right of your browser window, click the Settings icon.
- Click the Console tab.
- Select Preserve log.

Capture logs
- Press F12 on your keyboard (or right click on the page and select Inspect). The console appears on the bottom of the screen.
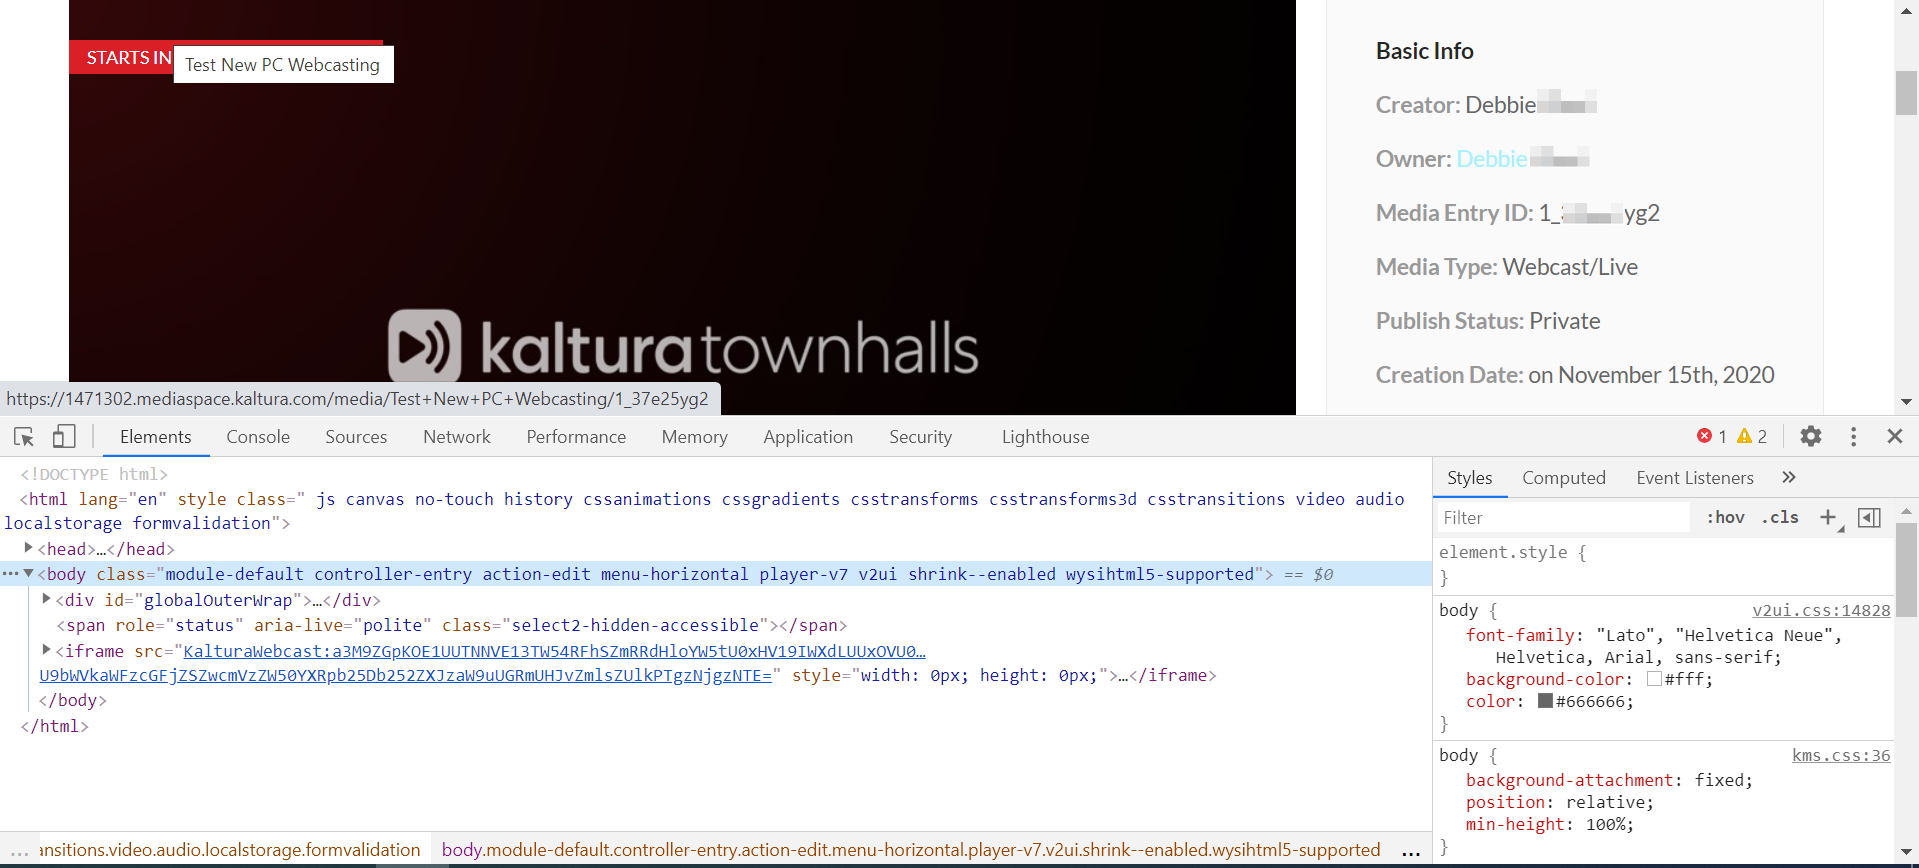
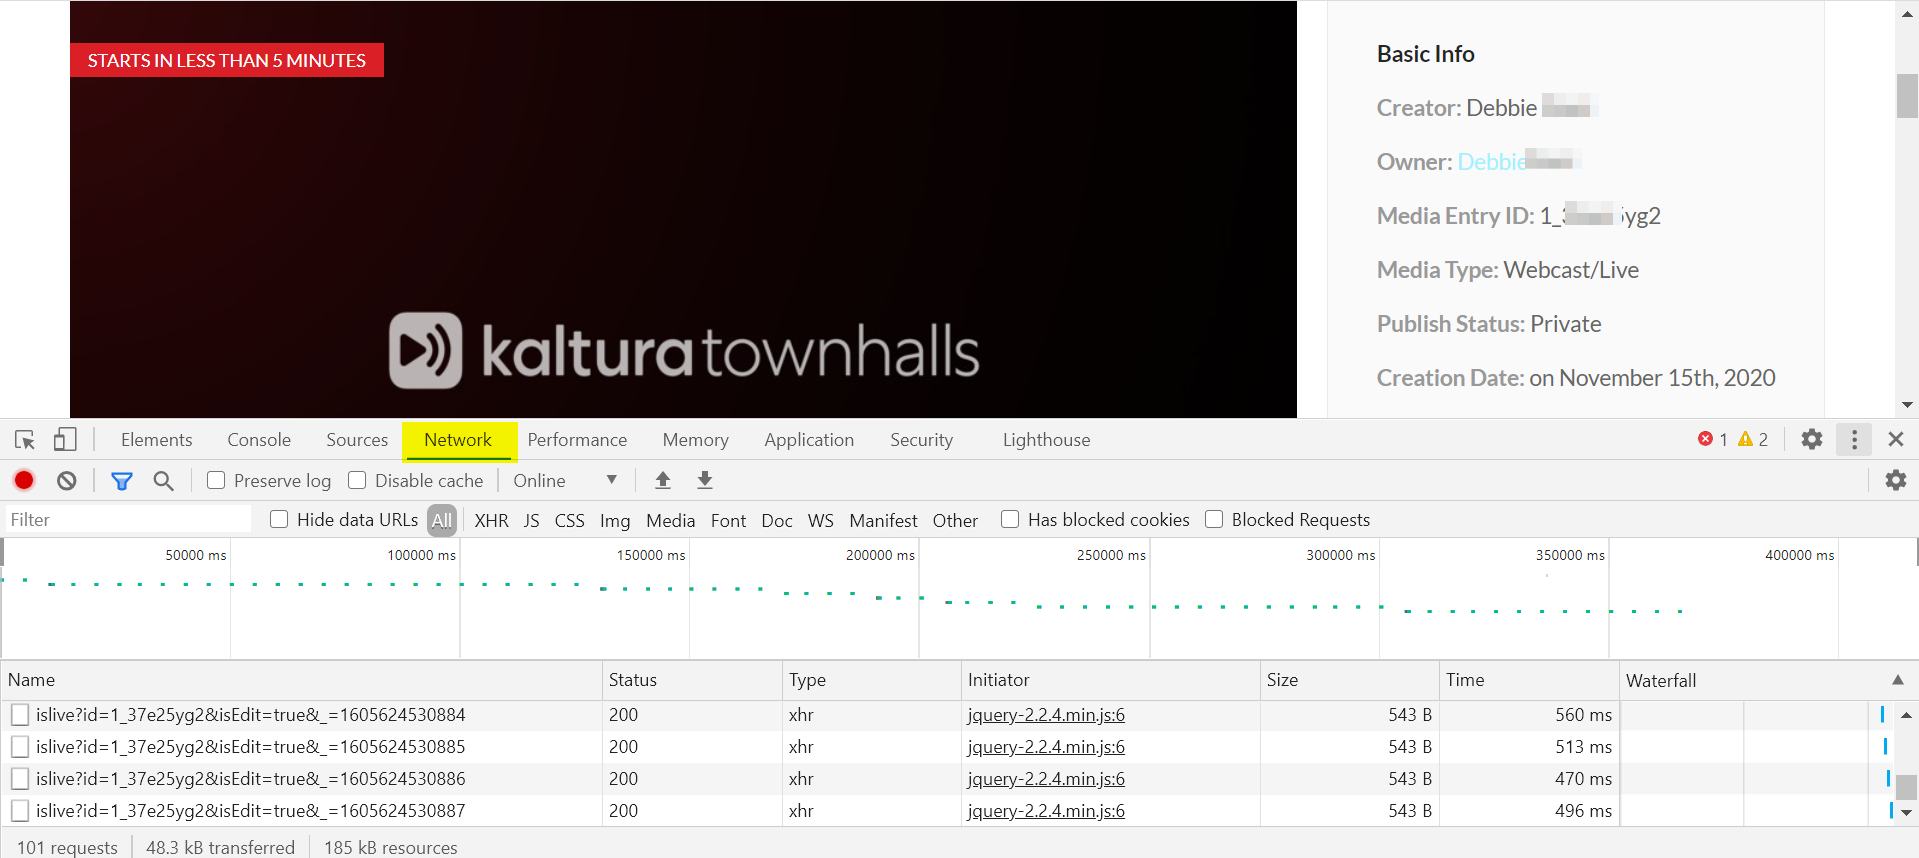
- On the console, select the Network tab.
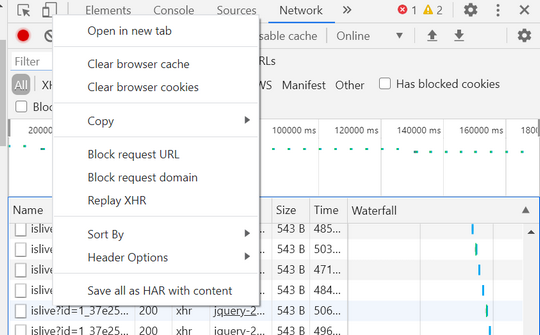
- Right click on any line and select Clear browser cache.
- Check Preserve log (optional, but useful if you need to capture logs across a page refresh).
- Recreate the issue while the console is open. You will see the HTTP traffic being logged.


Export logs
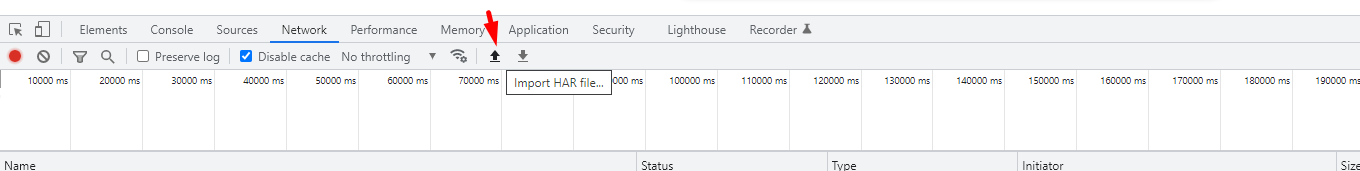
- Click the download icon (💾) in the Network tab toolbar to export the log as a .har file. This HAR file will include request and response content.
- Send the .har file to Kaltura support
- Select the import a .har file icon to view and inspect network logs directly in the Google Chrome browser.
If you're using an older version of Chrome, you may still see the 'Save all as HAR with content' option by right-clicking in the Network tab. In newer versions, this has been moved to the download button.
* Additional information about 'Chrome web debugger' can be found @ https://developers.google.com/chrome-developer-tools/docs/network.
To view an imported .har file in the browser
Chrome DevTools features change frequently. If you don't see the options described above, check your Chrome version or refer to https://developer.chrome.com/docs/devtools/network/reference/ for the latest interface.
Firefox dev tools
Persist logs
This is a checkbox that lets you persist logs between page refreshes.
To preserve the logs
- Press F12 on your keyboard (or right click on the page and select Inspect). The console appears on the bottom of the screen.
- On the console, select the Network tab.
- Select Persist logs.
Capture and export logs
- Press F12 on your keyboard (or right click on the page and select ‘Inspect Element’). The console appears on the bottom of the screen.
- On the console, select the Network tab.
- Clear the browser cache.
- Recreate the issue while the console is open. You will see the traffic being logged.
- Right click on any of the lines and select ‘Save all as HAR’.
- Send the .har file to Kaltura Support.
Additional information about Firefox network monitor can be found @ https://developer.mozilla.org/en-US/docs/Tools/Network_Monitor
Fiddler (Windows)
Capture web traffic
- Download 'Fiddler' software from https://www.telerik.com/download/fiddler
- Open the installer file and follow the installation instructions.
- After installation is complete, the software opens with Live Traffic Capturing as the default.
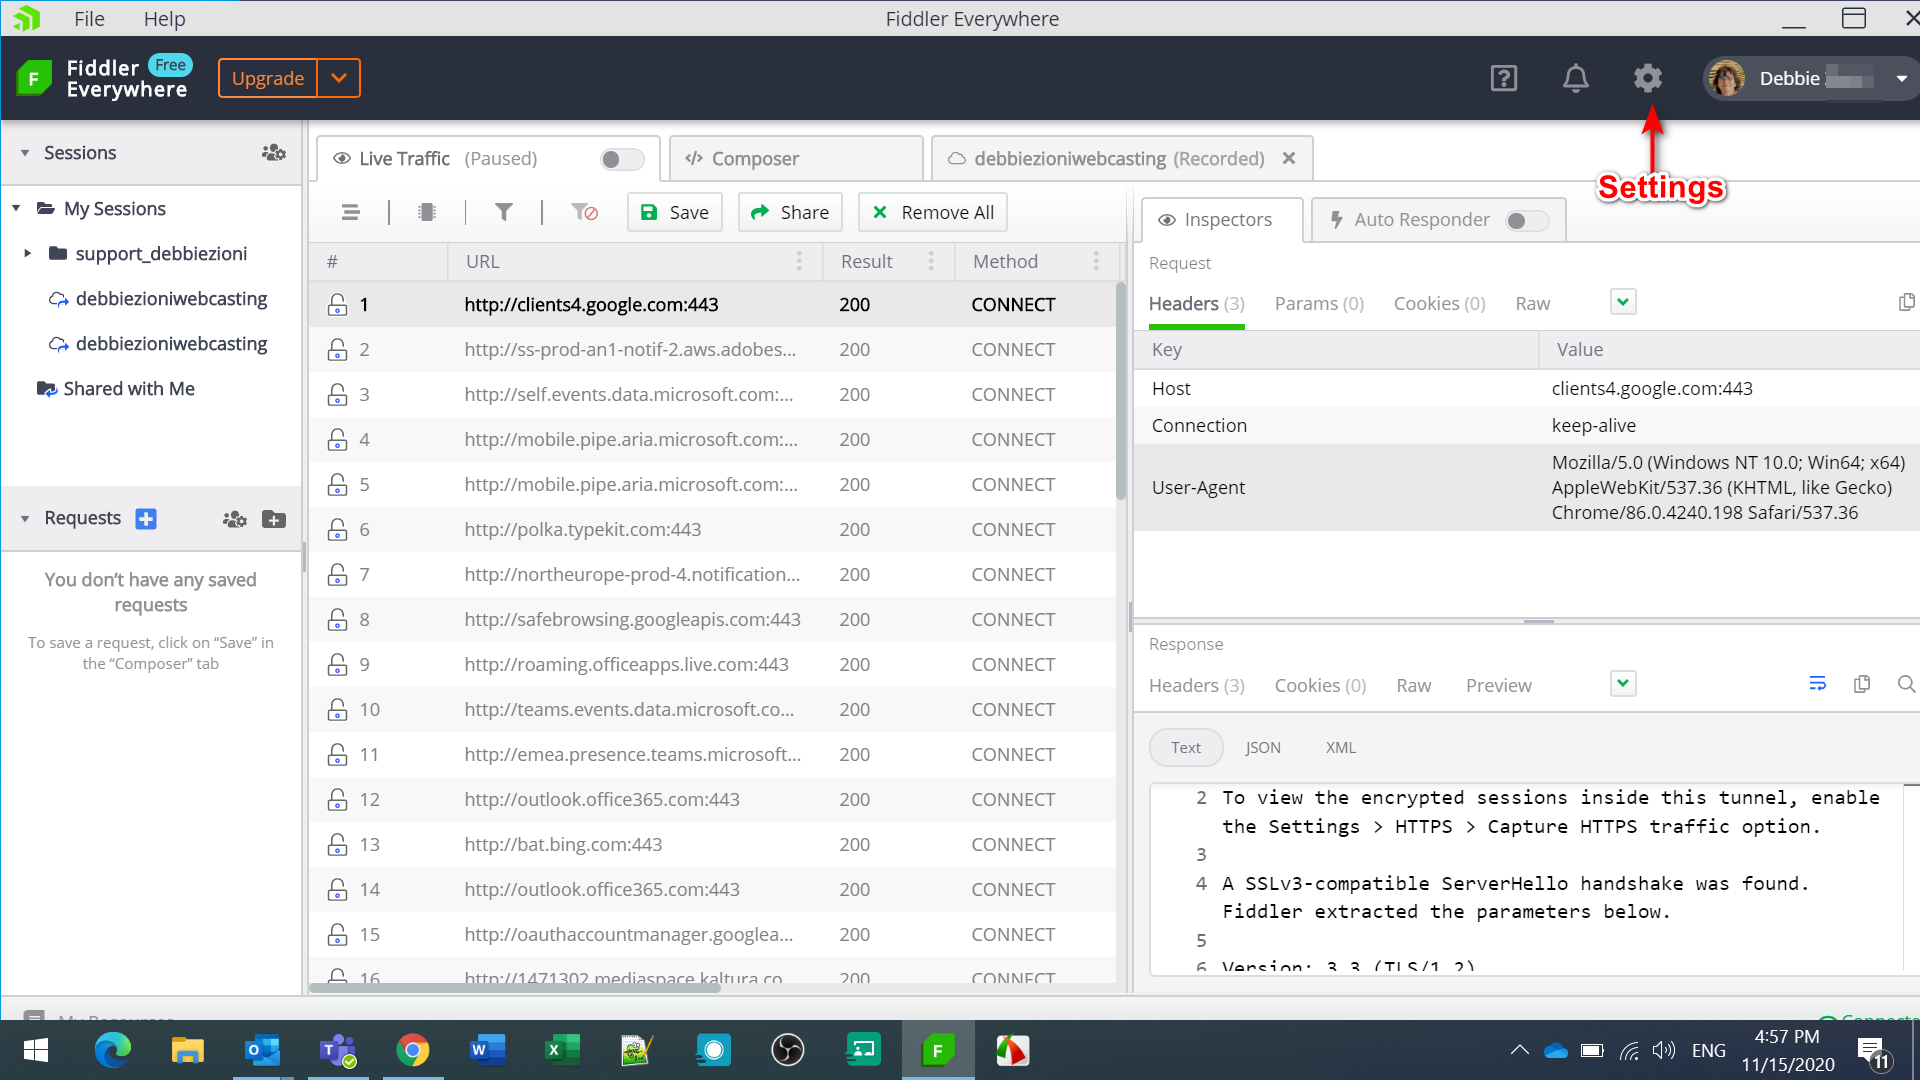
- To capture traffic that is transferred through HTTPS/SSL click on the Settings icon.
- Select the HTTPS tab and check "Capture HTTPS traffic.
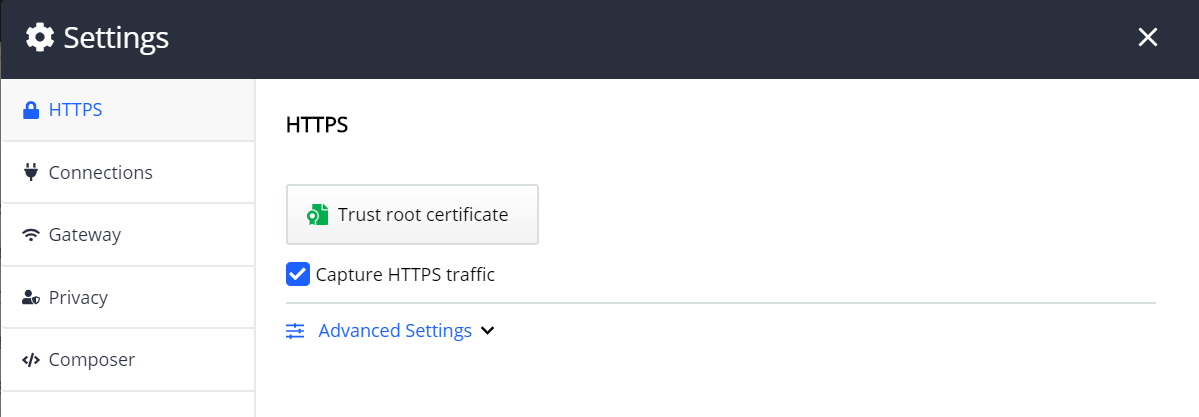
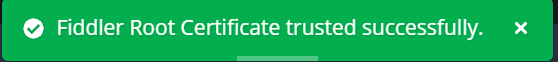
- Click Trust root certificate. The following message is displayed:
- Close the message and then click Save in the Http tab in the Settings window.
Fiddler captures the live traffic.
- Clear the browser cache.
- Recreate the issue while Fiddler is running and capturing.
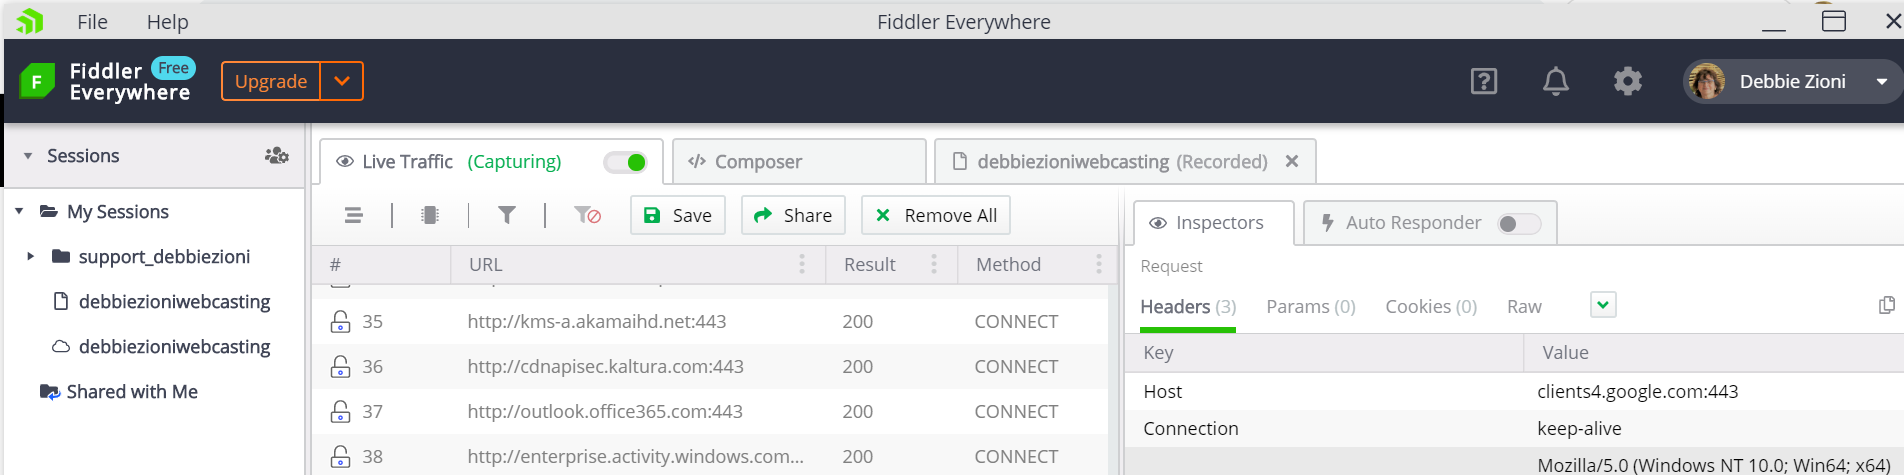
- To stop capturing the log, toggle off Live Traffic. Paused is displayed on the toggle.
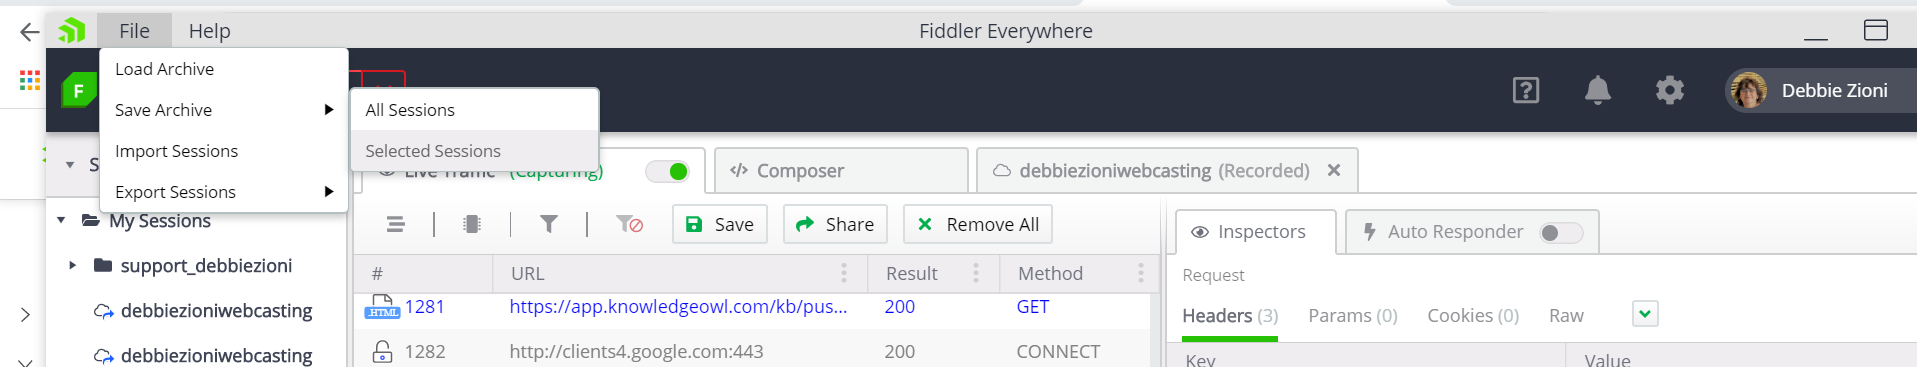
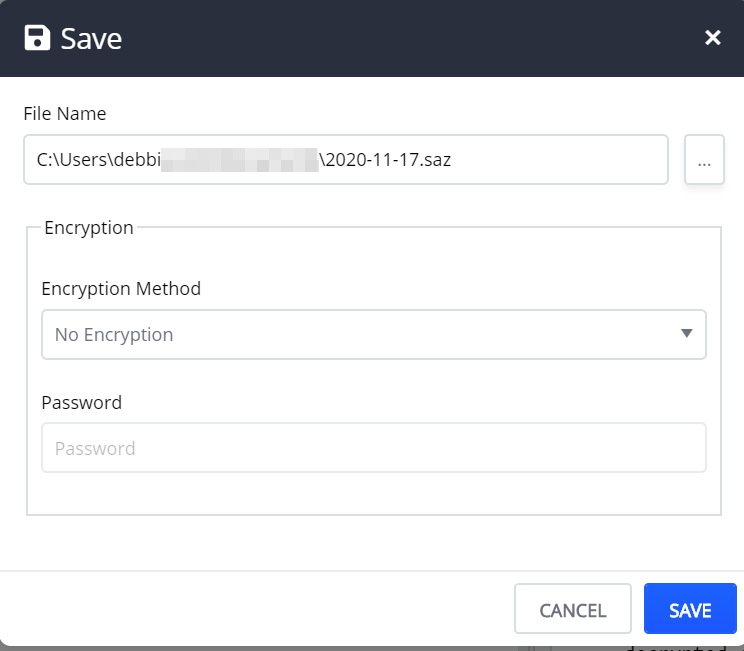
- After capturing the event, save it as a .saz file.
- Select File > Save Archive > Selected Sessions.
- Click Save.
Additional assistance on how to use the software can be found here: https://docs.telerik.com/fiddler/observe-traffic/tasks/capturewebtraffic


Charles Proxy
Capture web traffic
- Download the software 'Charles Proxy' from http://www.charlesproxy.com/download/
- Install the software and run it.
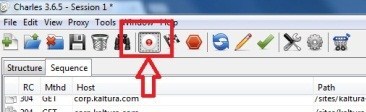
- When the software opens, in the upper left corner of the window the red dot "recording" should be highlighted – if it isn’t, click the button to “Start/Stop recording".
If you need to capture HTTP / SSL traffic, see http://www.charlesproxy.com/documentation/proxying/ssl-proxying/
- Clear the browser cache.
- Recreate the issue you are experiencing while Charles is running.
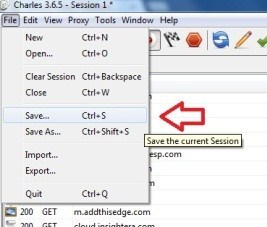
- When you are through recreating the issue, click on File->Save As, and select a unique name.
Additional information about 'Charles' can be found @ http://www.charlesproxy.com/documentation/


If you're logging into a website, your username/password and session data may be captured in the traffic log.
You can email attachments up to 25 MB. For larger files, please share a Google Drive link in the email instead of including it as an attachment, or use WeTransfer.com, a service that lets you send large files easily and conveniently.
