Accessing the Kaltura eCDN Monitoring Portal
To enable and configure your Kaltura eCDN account, contact your Kaltura representative.
Logging In
- After your account is enabled and configured, navigate to your Kaltura eCDN Monitoring account at:
https://ecdn-monitor.kaltura.com/dashboards
The Grafana Log In window displays. 
- Type your Username and Password then click Log In.

If you have multiple Partner IDs (PID), please use the following format to log into a specific PID in Grafana:
PID/<Username>
The eCDN Monitoring Portal is displayed.
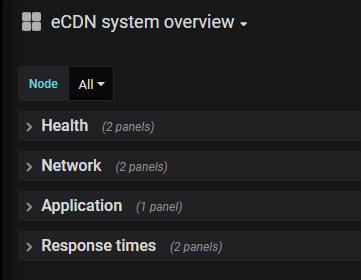
The eCDN Monitoring Portal contains the following three dashboards:
- eCDN System Overview - the default dashboard displayed when you login
- eCDN Node Overview - the dashboard describing the node activity
- eCDN Playback QoS – beta – shows the live analytics for the Kaltura Edge Server (KES)
You may view, share and perform other actions for each parameter on each dashboard. See eCDN Monitoring Board Actions for more information.
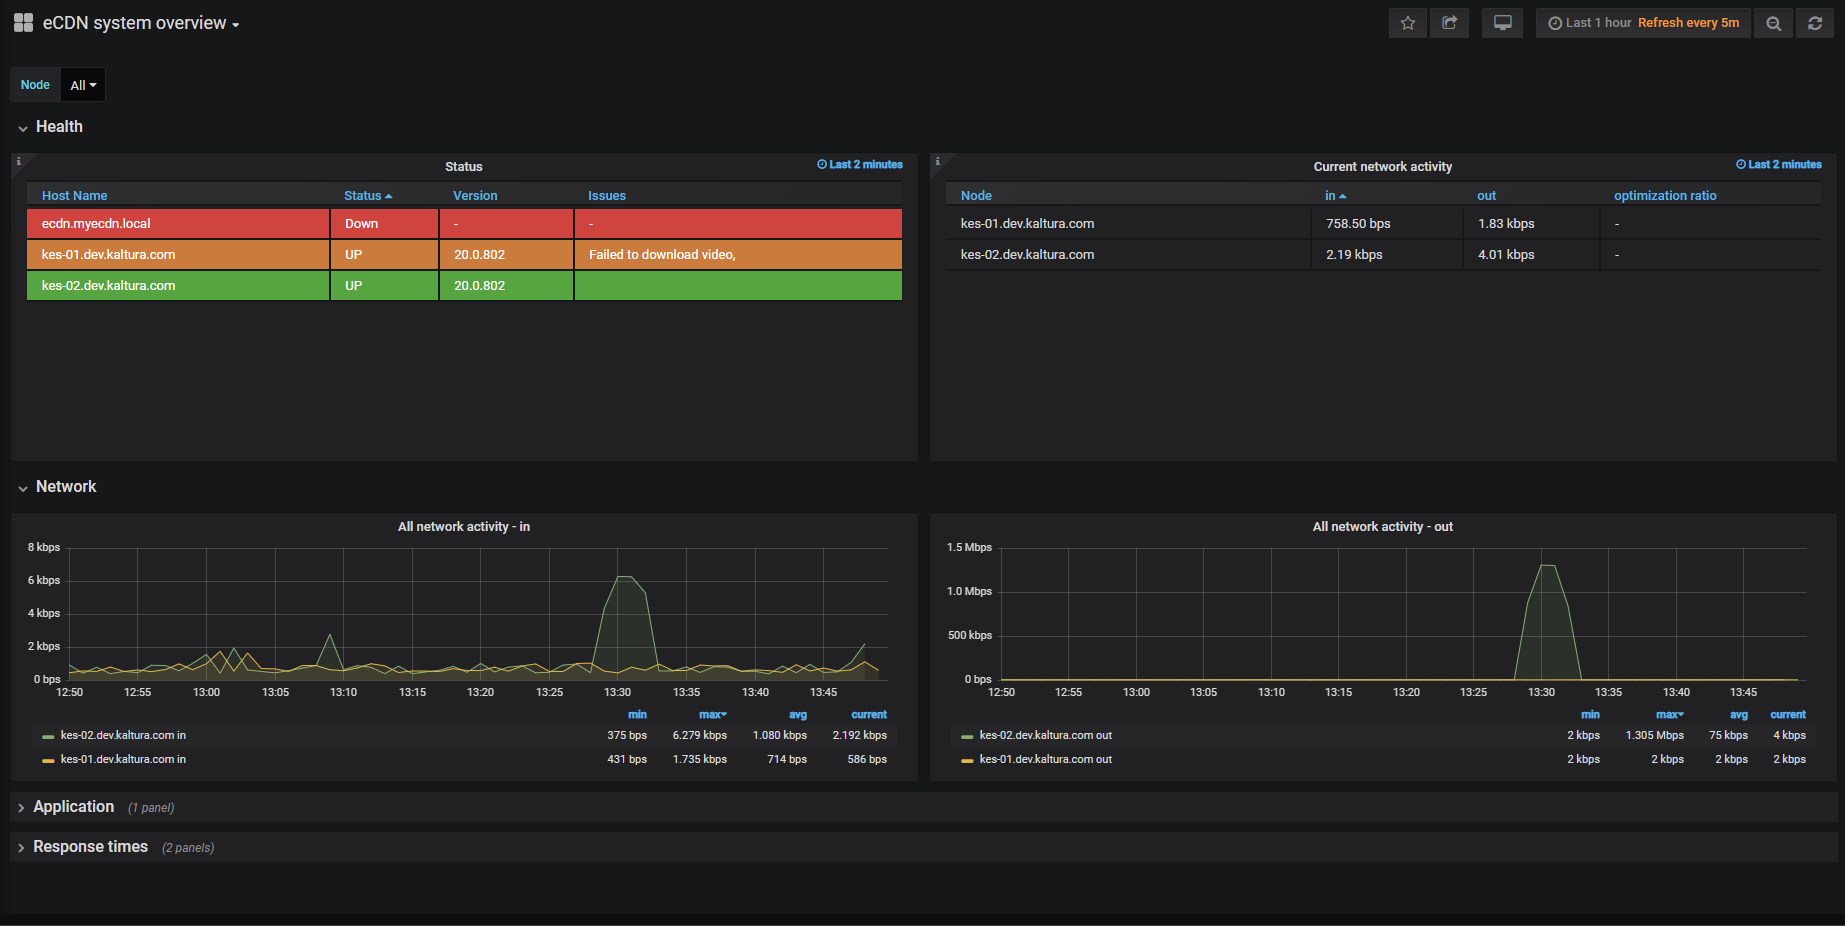
eCDN System Overview Dashboard
The eCDN System Overview dashboard displays the current network activity and the graphs showing application data for all of the servers installed system wide. The following tabs are available:
Health Tab
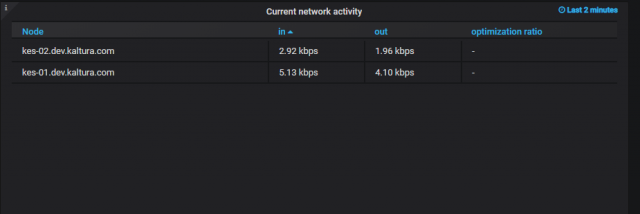
The Health tab displays the general health status of the eCDN servers also known as the Kaltura Edge Servers (KES) and the current network activity.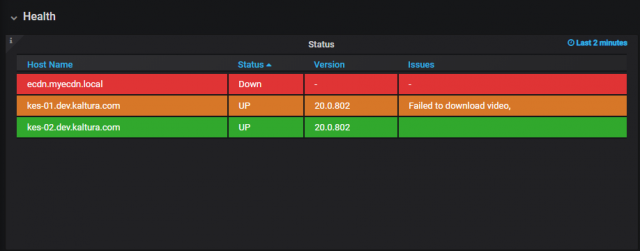
Status - current version and issues are indicated.
You may sort this list by server name by clicking the column header.
The Health column provides a color coded status indicator which indicates the overall health of that server.
The health status is an aggregate of the health status of individual services running inside this server. A mouse hover over the status indicator displays a popup that shows the health indicator of each component service.
- Green - indicates the server is healthy in all aspects. The status of all underlying component services on this server are healthy.
- Orange - indicates that the server is in the process of updating its configuration. It is a transient state. Usually configuration updates happen very quickly, and you will very rarely see the server status as pending.
- Red - indicates one or more component services is unhealthy.
Current Network Activity - Displays the current in-out traffic per node.
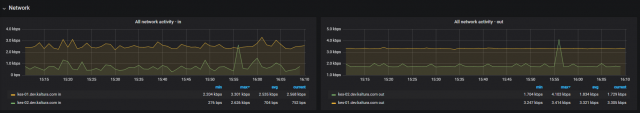
Network Tab
The Network tab displays all inbound and outbound network activity.
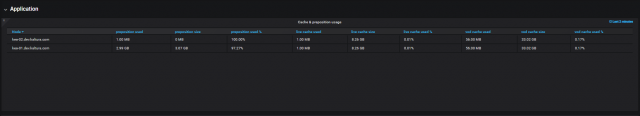
Application Tab
The Application tab displays pre-positioning live and cache usage during the last 2 minutes.
Response Times Tab
The Response Times tab displays how many users are requesting entries and what is the response time from the server.
Live Response Time - displays the maximum response times for 95% of the requests for live.
VOD Response Time - displays the maximum response times for 95% of the requests for VOD.
eCDN Node Overview Dashboard
The eCDN Node Overview dashboard displays specific server data and may be used to debug servers. The following tabs are available:
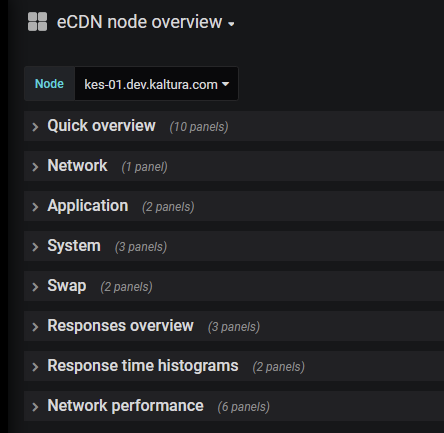
Quick Overview Tab
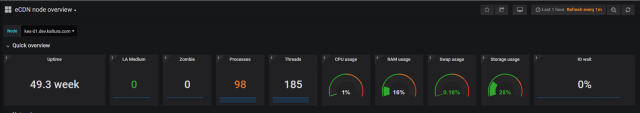
Uptime - Indicates the elapsed time that this server node was last started.
LA (Load Average) Medium - Average CPU load for the node's load over the last 5 minutes
Zombie - Processes in the node that are dead but have not been removed by the parent
Processes - The total number of processes in any state on the node.
Threads - The total number of threads in any state on the node.
CPU Usage - Indicates the CPU usage percentage in the node.
RAM Usage - Indicates the memory usage percentage in the node.
Swap Usage - Indicates the percentage of RAM swap space in use in the node.
Storage Usage - The percentage of used disk space in the node.
IO Wait - The percentage of single CPU time that is idle waiting for the disk operation to complete in the server node.
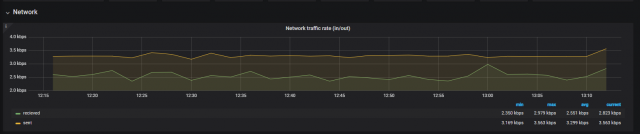
Network Tab
The Network tab displays the network traffic rate over time in the node.
Application Tab
The Application tab displays preposition live and cache usage over time.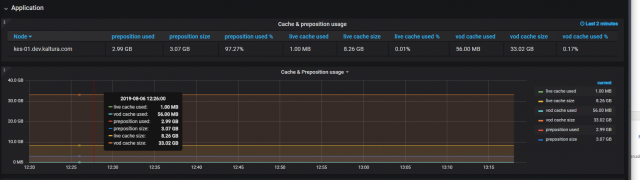
System Tab
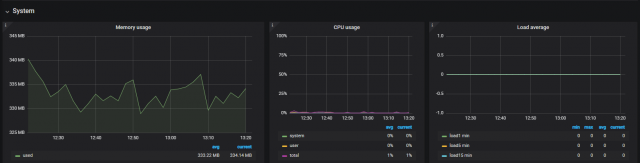
Memory Usage - Displays the average memory allocation by usage.
CPU Usage - Displays the percentage of CPU time spent in each of its state (system, Idle, io wait, etc.) in the node.
Load Average - Displays the average CPU load over time frames of 1, 5, 15 minutes on the node.
Swap Tab
The Swap tab displays the Swap and disk usage.
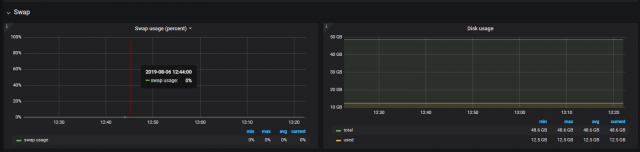
Swap Usage - displays the swap usage percentage in the node over time.
Disk Usage - displays the disk space allocation over time in the node.
Responses Overview Tab
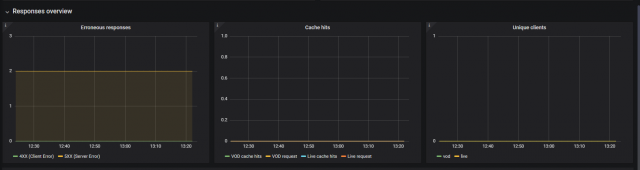
Erroneous Responses - Displays the number of the response status codes from the node.
Cache hits - Displays the number of requests for both live and VOD and their cache hits
Unique Clients - Displays the number of unique clients for both VOD and live (ts requests)
Response Time Overview Tab

Response Time Histograms Tab
This tab provides histograms showing when you have users requesting entries from KES and will populate with the response times from the server to the user.
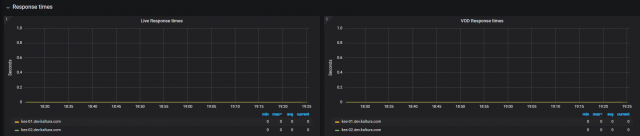
VOD Response times - Displays the histogram for video chunks (ts) response times for VOD
Live Response times - Displays the histogram for video chunks (ts) response times for Live
Network Performance Tab
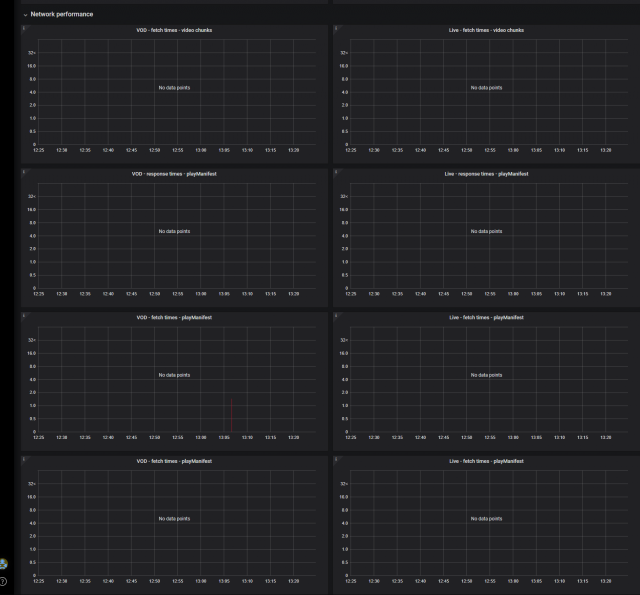
VOD - fetch times - video chunks - histogram for video chunks (ts) fetch times for VOD
Live - fetch times - video chunks y histogram for video chunks (ts) fetch times for Live
VOD - response times - playManifest histogram for playManifest response times for VOD
Live response times - playManifest histogram for playManifest (m3u8) response times for live
VOD - fetch times - playManifest - histogram for playManifest (m3u8) fetch times for VOD
Live - fetch times - playManifest - histogram for playManifest (m3u8) fetch times for Live
eCDN Playback QoS Dashboard
The eCDN Playback QoS dashboard displays all the data needed to monitor a live event. The following tabs are available:
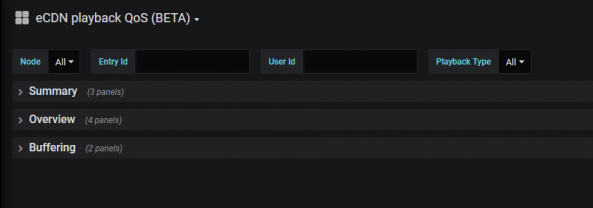
You can filter data on the QoS dashboard. See Filtering Options for the QoS Dashboard.
Summary Tab

Unique Known Users - Displays the number of unique known users that have signed in to view the content.
Average Buffering Ratio - Displays the(time user buffered)/(total play time)
Average Bitrate - Displays the (total number of bits downloaded by all players)/(number of seconds)
Overview Tab
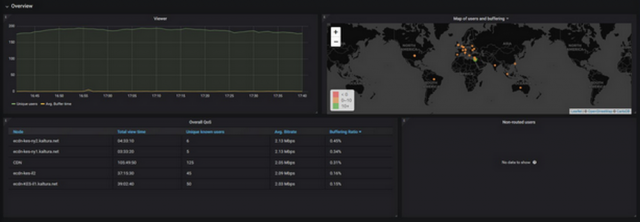
Viewer Panel
Dual line graph showing the number of viewers over time as one line and the Average buffering rate as the second line.
Map of Users and Buffering Panel
The distribution of the viewers around the world. The location is set by the IP address sent by the player. If the video is being viewed through the eCDN, the location will be the eCDN location.
Overall Qos Panel
This panel displays how each KES is performing for the following metrics:
- Total View Time
- Unique known Users
- AVG. Bitrate
- Buffering Ratio
Non-routed Users Panel
Users that are viewing the video NOT through the KES.
Buffering Tab

Top User Buffering
The Top User Buffering table provides buffering data grouped by users. The following data is shown for each identified user ID:
- Entry ID
- Entry Name
- Node
- Internal IP
- Total View Time
- AVG. Bitrate
- Buffering Ratio
Top Browser Buffering
The Top Browser Buffering table provides buffering data grouped by types of browsers. The following data is shown for each browser:

You an view how well each one of the browsers is performing for the following mertics:
- Total View Time
- Buffering Ratio
eCDN Monitoring Board Actions
- Hover over the component name and click the arrow to access the Actions menu.
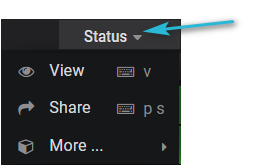

The following actions are available:
View - select to display the component's section individually.
Share - select to create a direct link, embed code or snapshot to this specific dashboard or panel. You may customize the sharing option.
More - select Panel JSON to copy the code to a clipboard or Export CSV - to export data to a CSV file.
Filtering Options for the eCDN Playback QoS Dashboard
Filter by Node - Click on the arrow to use the drop down menu to filter by node.
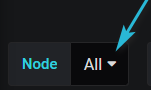
The following options: are available
- All - Do not filter the data - include all data
- CDN - Show only data coming from the CDN.
- No KES - Show only data coming from users that are not routed to any KES.
- KES display data for an individual KES installed in the system
Enter a specific entry ID to only view its QoS data for that entry.
Enter a specific User ID to only view that specific user's QoS data
Filter by Playback type - Click on the arrow to use the drop down menu to filter by playback type.
- All - Do not filter the data - include all data
- Live - View only Live events data
- VOD - View only VOD events data
- DVR - View only Live events data from users that are viewing the DVR
