About
The Services dashboard gives administrators a centralized view of all REACH captioning and translation requests. From this dashboard, you can track usage, monitor credit status, filter and review service requests, manage department-level billing, and approve or reject pending orders.
Access the services dashboard
Video Portal
Select Services Requests from the user drop-down menu.

The Service Requests page displays.

KMC
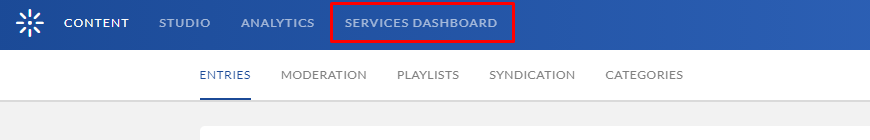
Select Services Dashboard from the top navigation bar.
Dashboard overview
The Services Dashboard provides a snapshot of your organization’s captioning and translation activity. It includes:
- Your available line of credit for ordering services
- The Unit or Department that submitted requests (only shown if more than one is configured)
- A visual graph showing total service requests and their statuses
- A download icon to export a report of all orders
- Filters to refine the view by language, service type, turnaround time (TAT), and more
- A moderation section to manage pending approvals
- Usage metrics and historical request data
Use the dashboard to track service usage, monitor departmental activity, and manage approvals across your organization.
For department-level billing and moderation setup, see REACH department level billing and moderation.
Display department-level billing and moderation
If your instance is configured with multiple REACH profiles (units or departments), you'll see a Unit/Department dropdown at the top of the dashboard. Use this to switch between departments and view or compare their service usage and requests.
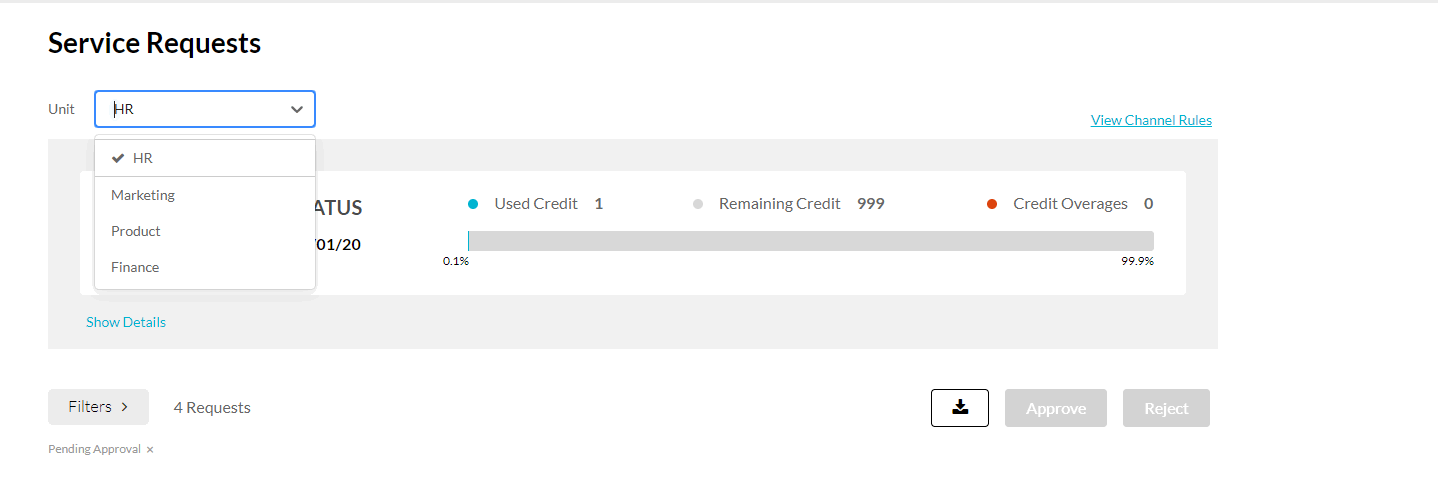
If you have several REACH Profile IDs (also known as Units or Departments) configured on your instance you can switch between them at any time to see and compare usage metrics.
View credit status
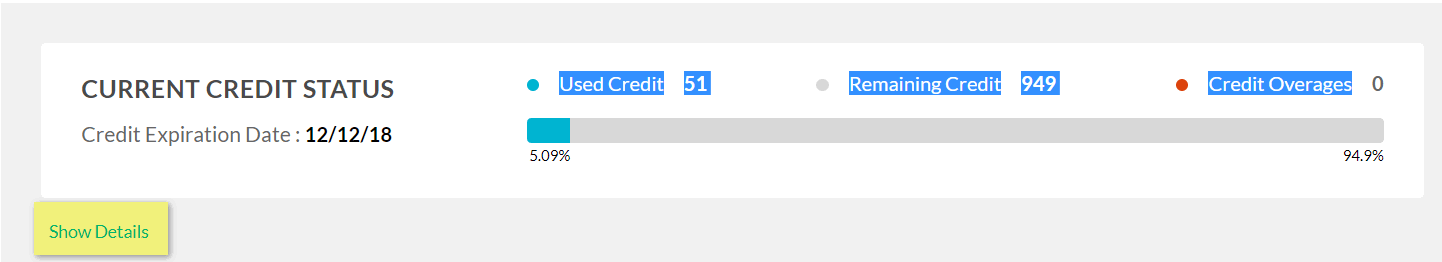
The current credit status is displayed on the dashboard. The information includes:
- Credit Expiration Date
- Used Credit
- Remaining Credit
- Credit Overages
Click Show Details to open the Services Status Dashboard. Click Hide Details to close the dashboard.
Services status dashboard
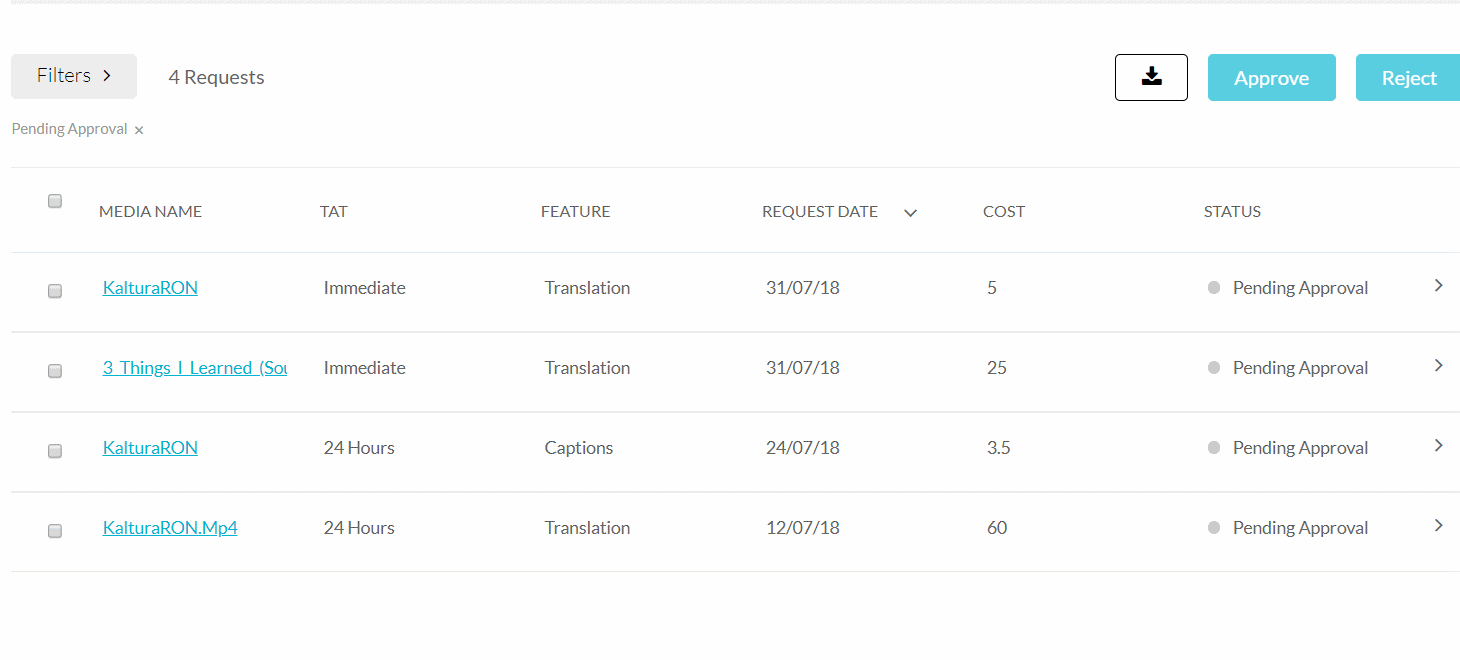
The Services Status Dashboard displays information and status for the captions (machine, human) and translation requests.
By default, the list will present only the 'Pending Approval' requests.
To view all requests, click Filters and remove the status filter.

Filter service requests information by period
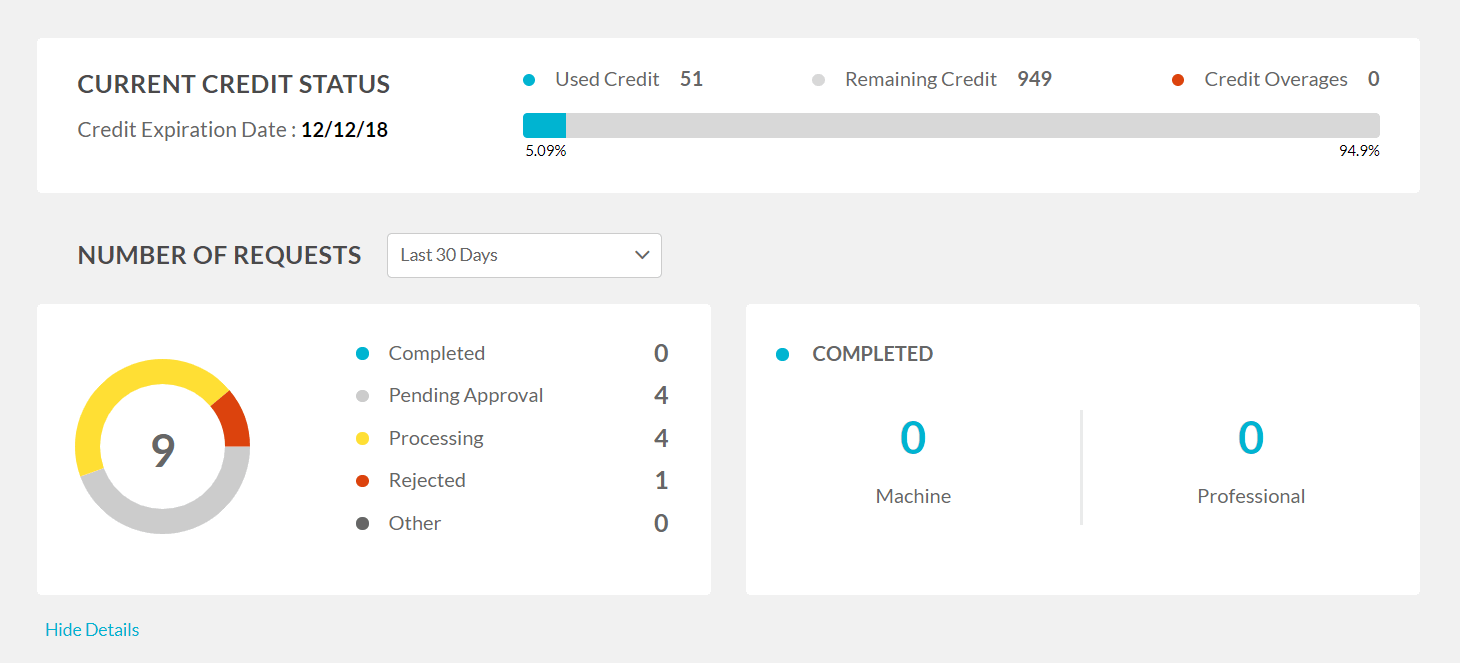
- Select an option from the Number of Requests drop-down.
Display statistics for each status
- Click on the status. In our example below, 'Pending Approval' indicates that there are four requests pending approval. The Processing section shows that there is one request for 'Machine' and three requests for 'Professional' captions pending approval.


Services moderation dashboard
This section displays a list of service orders awaiting approval. From here, you can quickly approve or reject individual requests.
Moderation needs to be set up in both the KMC and video portal:
- In KMC: Enable moderation for each REACH profile ID (see Reach profiles and services).
- In video portal: Go to the Configuration Management console and set up moderators and entitlements in the REACH module.
Approve or reject a service order
- Check the box next to an existing order.
- Press Approve or Reject.
A confirmation message is displayed to confirm your choice
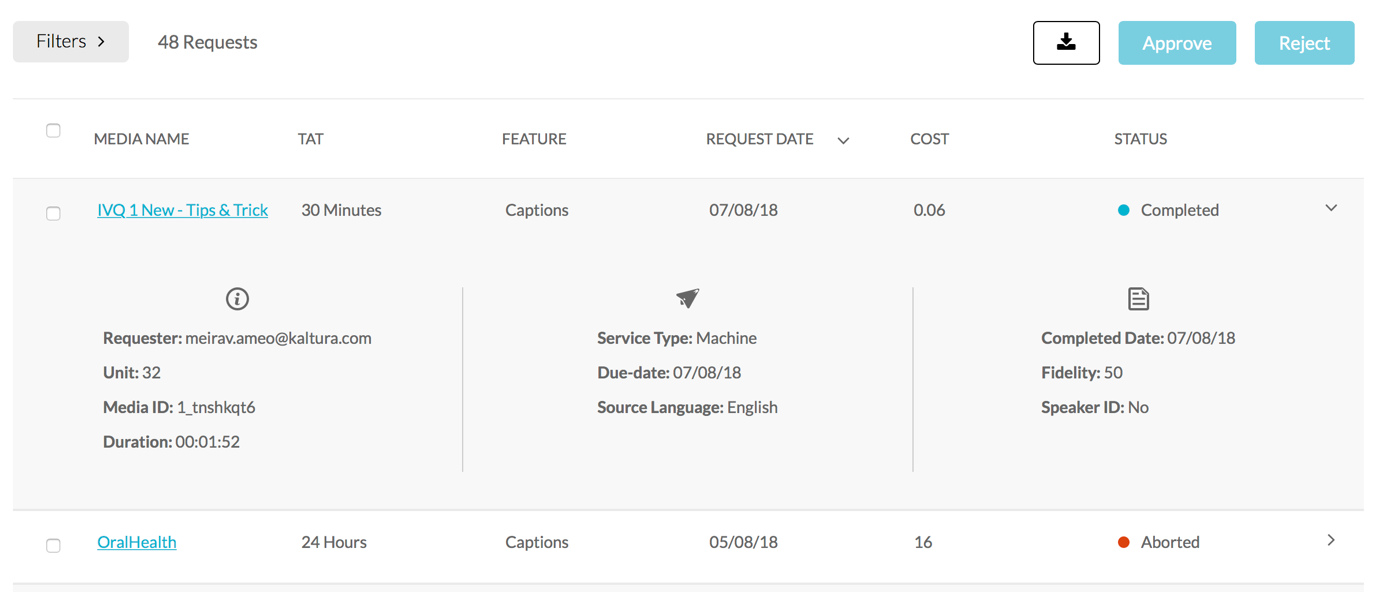
Show more details for each request
- Click the arrow next to the service request. Additional information displays including the Requester, the Unit, Media ID and the Duration. The Service type and Source and Target Languages, and the Speaker ID option are displayed.
Click the arrow to close the additional details.
Filtering options
Use the Filters option to filter requests and orders. The number of Requests is displayed. If you checked an order to view or modify it will indicate that the order is selected.
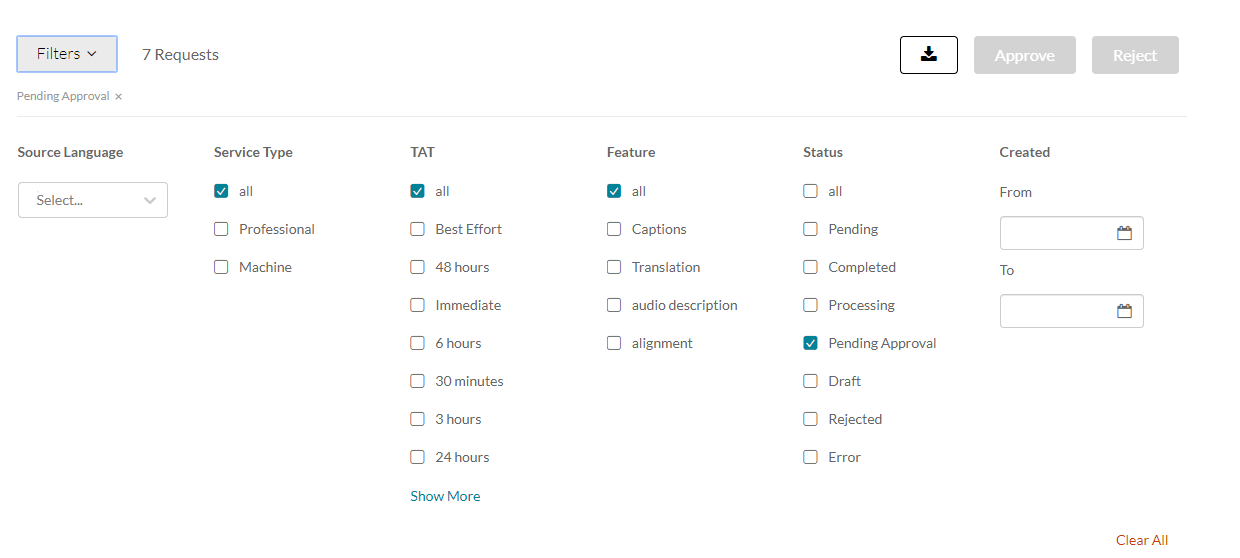
You can filter your order requests by:
- Source Language – select a language from the drop-down.
- Service Type
- Feature
- Turnaround Time (TAT)
- Status
- Date Created – Enter From and To values.
You can see all requests by checking All under each filtering option. Select Show More to see more information.