About
This article describes how to view analytics across your webinars.
Clicking All re-directs you to the Webinars Home page. In the image below, notice the All button located at the top left corner of site page.

The Home tab is the default open tab upon navigating to the Webinars Home page.

Click the Analytics tab.

The first portion of the page (shown above) provides information on highlights, top videos, and insights.
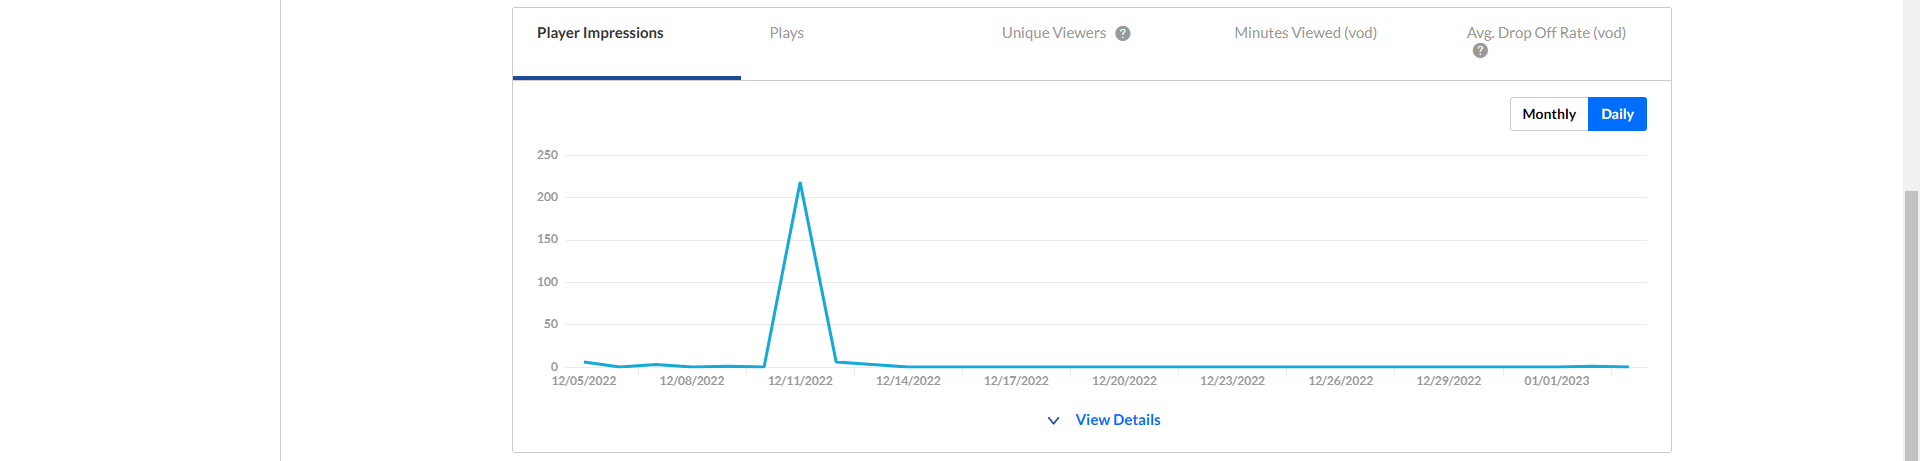
The second portion (shown below) provides information on player impressions, plays, unique viewers, minutes viewed, and average drop off rates.
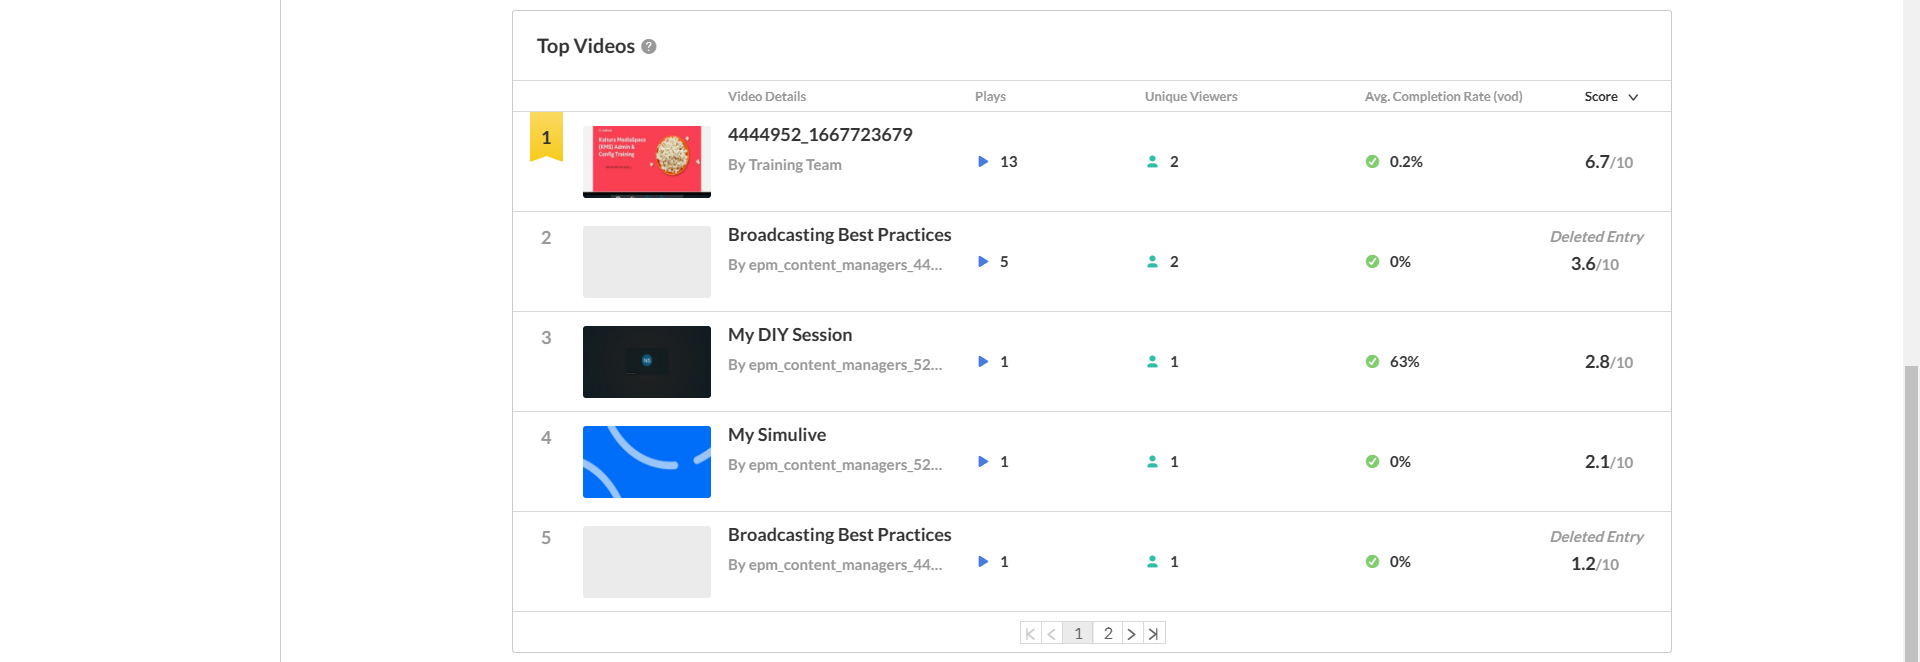
The third portion (shown below) focuses on top videos.
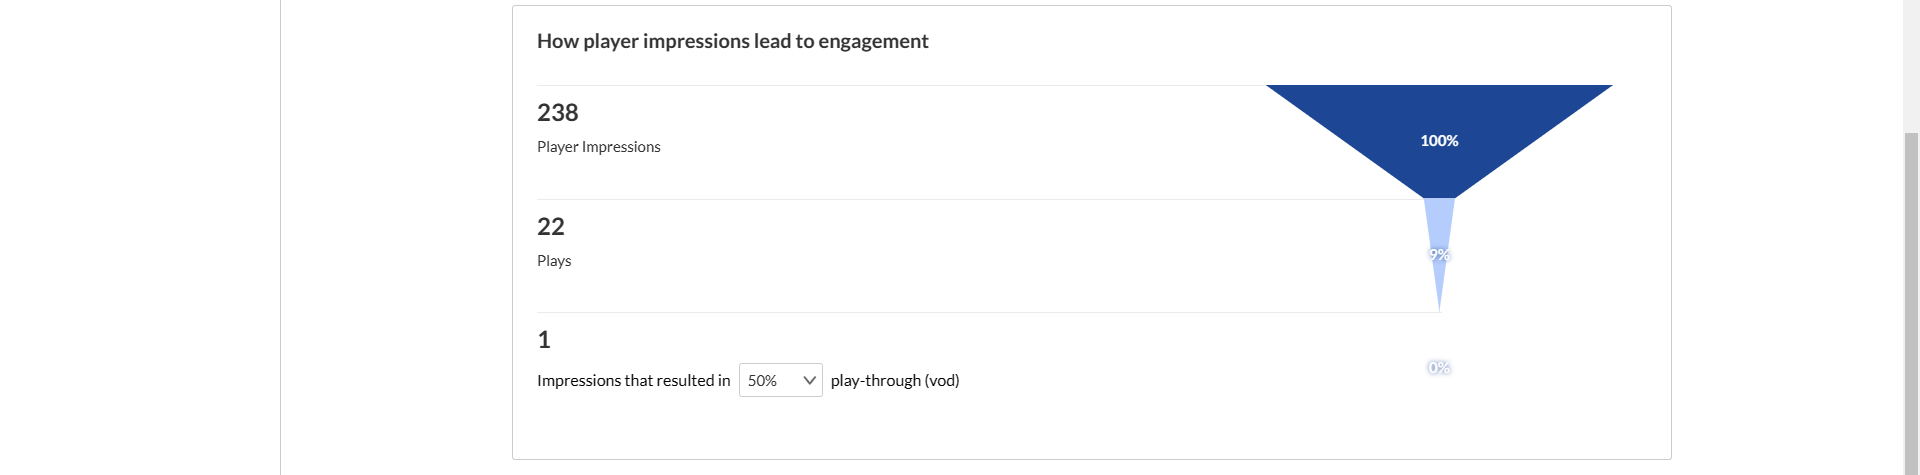
The fourth portion (shown below) provides information on how player impressions led to engagement.
💡You may also perform the following additional functions on the Analytics page:
Export specific analytics
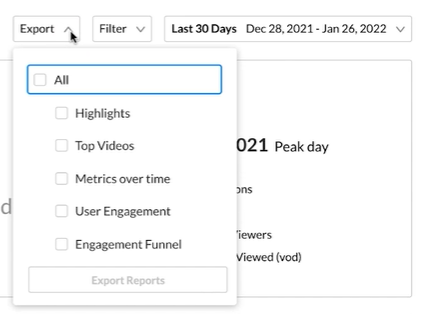
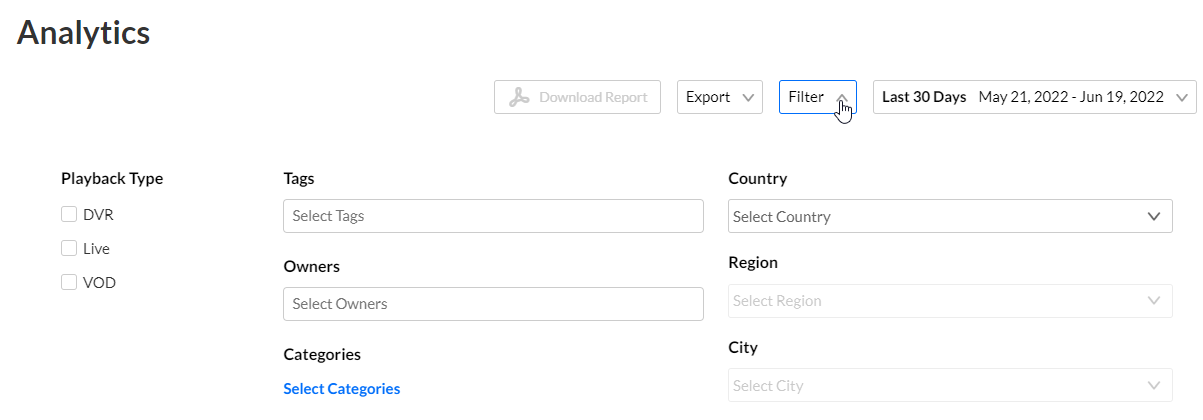
Filter by several different data points
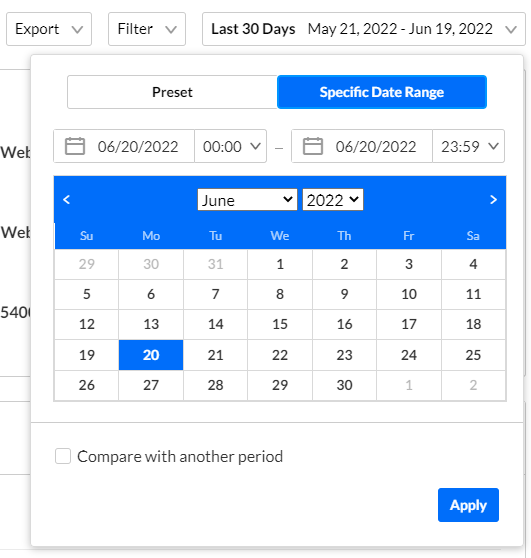
Sort based on specific dates or time
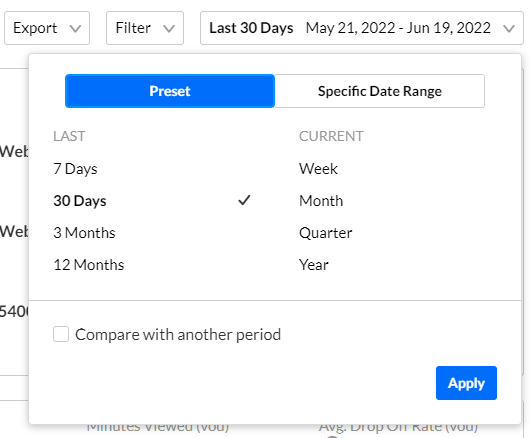
Compare data from one period to another
Download report
You may click the Download Report button to download a PDF version of the dashboard.
