About
This article describes how to view analytics on your users.
The screens shown here represent a multi-session event. The same actions apply when working with single session.
Navigate to user analytics
There are two ways to reach user analytics:
- From the Event page -
- Click the People tab > All users.
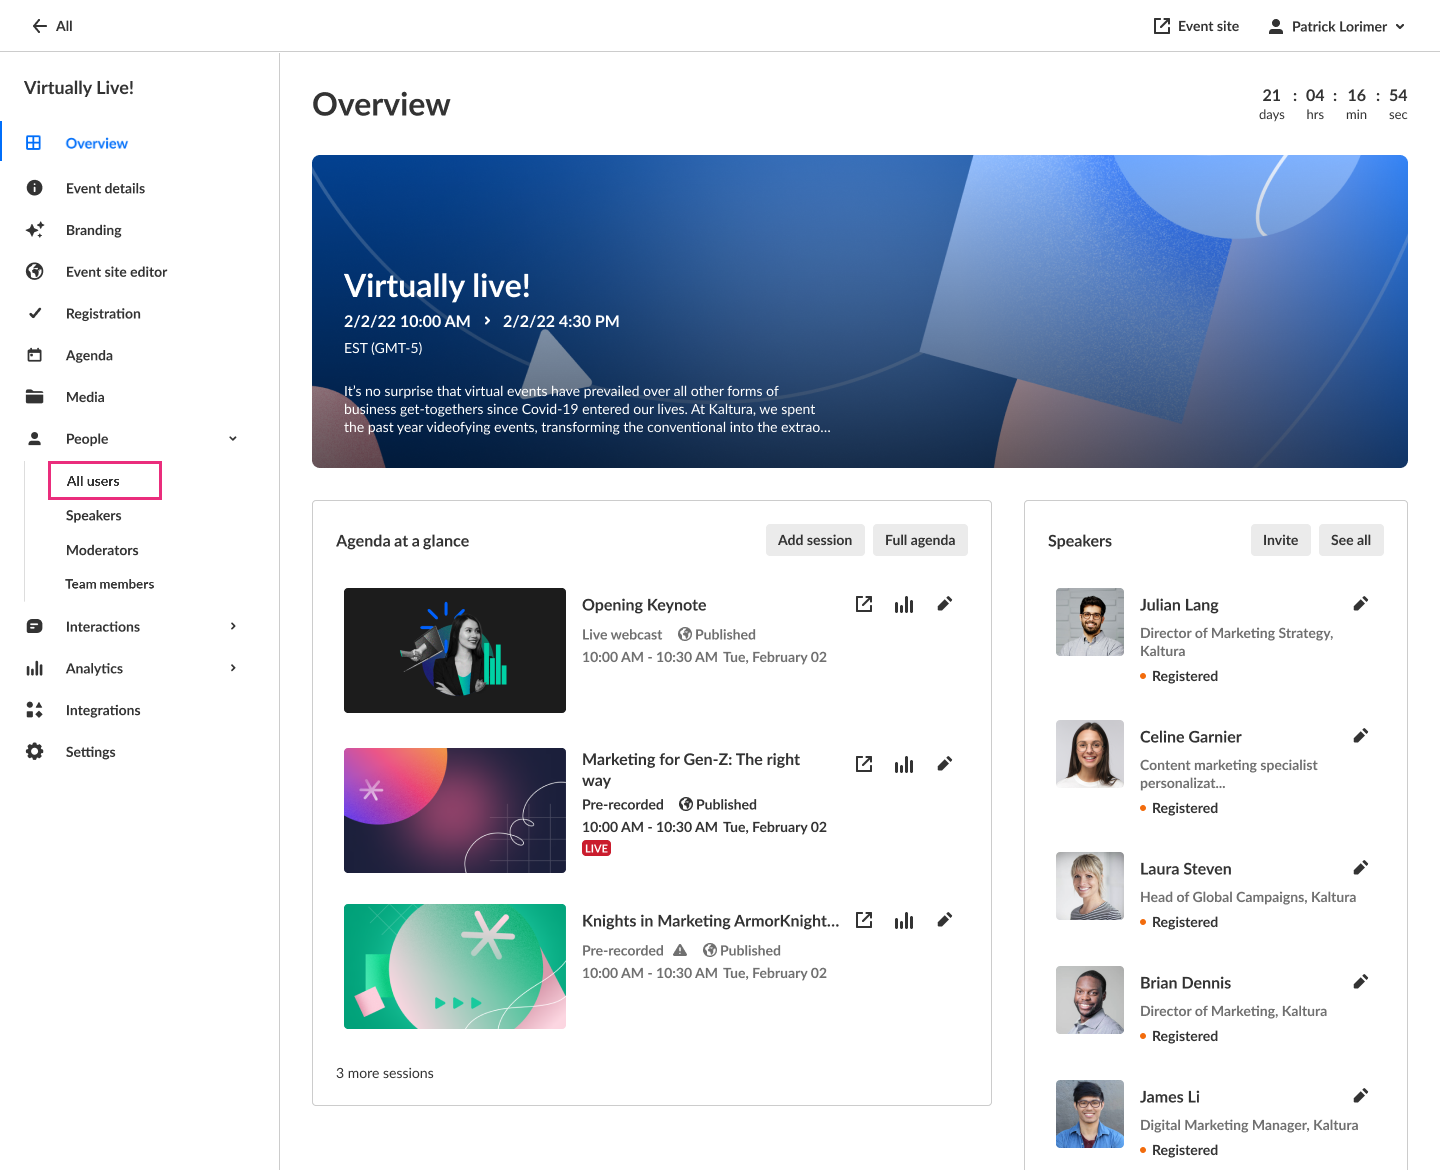 The All users page displays.
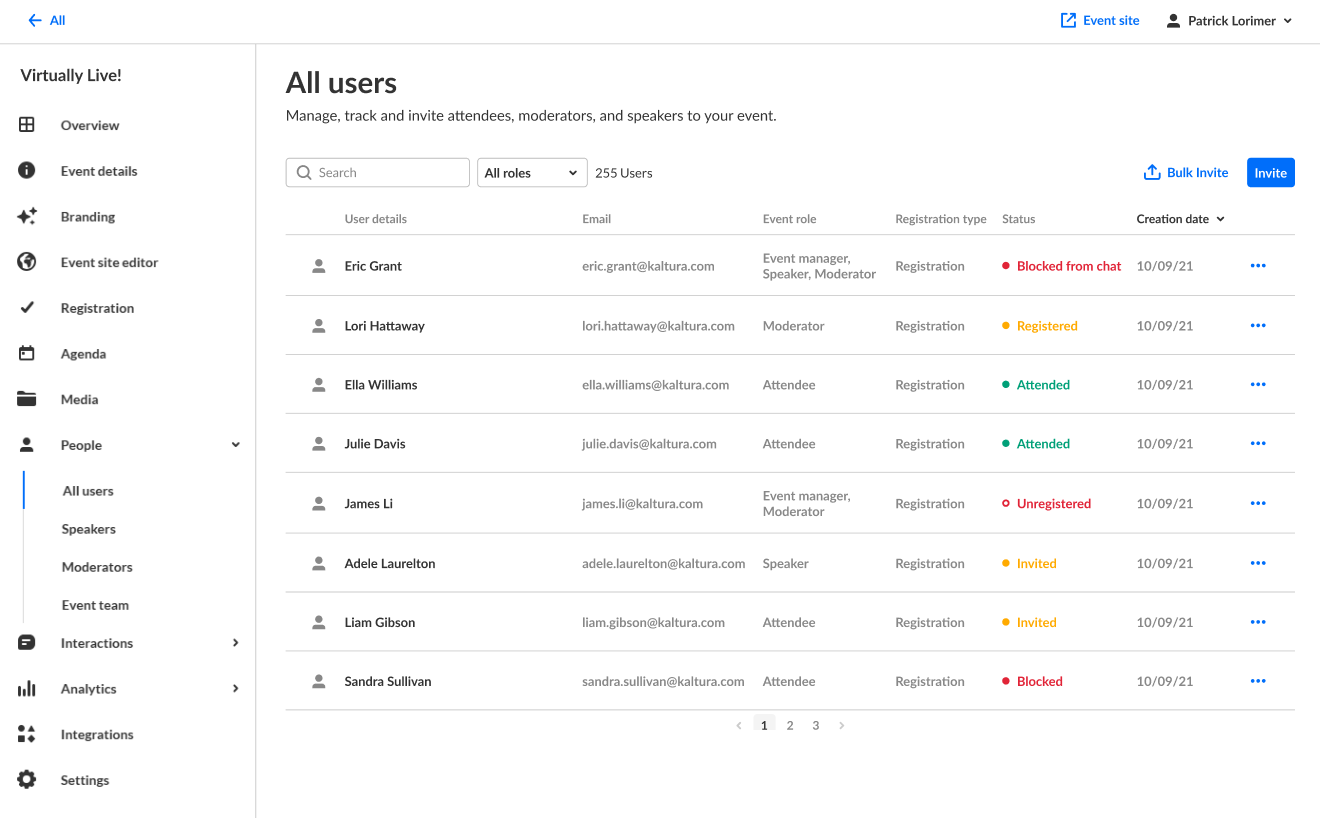
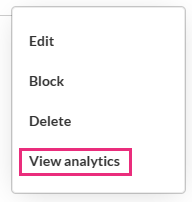
- Click the three blue dots to the right of the creation date and choose View analytics.
- Click the People tab > All users.
-
From the Session analytics dashboard -
- Click on a user's name in the Attendees area.
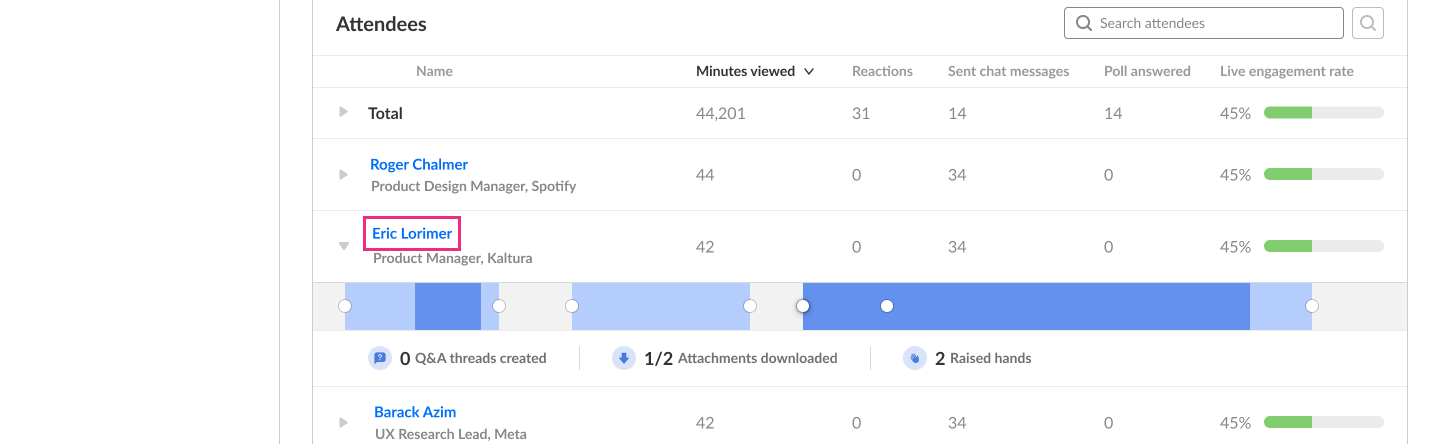
- Click on a user's name in the Attendees area.
 The All users page displays.


Section Descriptions
User profile information and basic user details are displayed at the top of the dashboard, including the following:
- User name (1) - Name of specific user
- User details (2) - Role, company, industry, and country

Key performance metrics for the user are also displayed at the top of the dashboard, and are calculated or determined as follows:
- Total minutes viewed (3) - Sum of minutes viewed across all content types for specific user
- Sessions viewed (4) - Number of sessions viewed
- Average live engagement rate (5) - Average engagement rate across all live sessions attended by user
- Videos viewed (6) - Number of videos viewed

User's engagement metrics across different interaction types are displayed, and are calculated as follows:
- Reactions (7) - Number of reactions sent by specific user in the event
- Chat messages sent (8) - Number of group chat messages sent by specific user in the event
- Poll responses (9) - Number of polls where user submitted answers
- Q&A threads created (10) - Number of Q&A threads opened by specific user in the event
- Attachments downloaded (11) - Number of unique attachments downloaded by specific user

A detailed breakdown of user's viewing time across different content types is displayed, and is calculated as follows:
- Live (12) - Sum of minutes viewed during live sessions
- Recordings (13) - Sum of minutes viewed of session recording
- Content on demand (14) - Sum of minutes viewed of additional on-demand content uploaded to the event

A detailed list of attachments that were downloaded by the user are displayed and determined as follows:
- Number of attachments downloaded (15)
- Name (16) - Attachment title with file type icon
- Source (17) - Session from which the attachment was downloaded

A detailed breakdown of user's participation in individual sessions is displayed, and is calculated as follows:
- Session name (18)
- Minutes viewed (19) - Sum of minutes viewed filtered by user ID and session entry ID
- Engagement rate (20) - User's live engagement rate

Click the down arrow to the left of the session name to expand the section and view additional information.
- Reactions (21) - Number of reactions sent by the user in the session
- Raised hands (22) - Number of raised hands in the session
- Attachments downloaded (23) - Number of attachment downloads by the user in the session
- Chat messages sent (24) - Number of threads created by the user in the session
- Polls answered (25) - Number of polls answered by the user in session

Quick tip - You may click the session name to navigate to the session analytics.
The user's viewing behavior for on-demand content is displayed, including detailed completion metrics for all VODs in the event.
This includes on-demand content uploaded to the event, apart from session recordings.
- Name (26) - Title of content
- Minutes viewed (27) - User's viewing time
- Completion rate (28) - Percentage of content completed

Quick tip - You may click the content name to navigate to the VOD analytics.
Download report
Click the Download Report button to download a PDF version of the dashboard.
