During the Webcast event, you can view live analytics for your event. Live analytics can provide you with information on audience engagement and the quality of the broadcast. The producer application displays part of the live analytics available. Monitoring the live analytics during the event provides important information about your live event, such as:
- A drop in users may indicate that there are technical issues or that viewers are losing interest.
- Monitoring the average bitrate activity lets you understand the quality received on the viewers' side.
For more information about live analytics, see Webcasting Entry Level Analytics.
Accessing Live Analytics
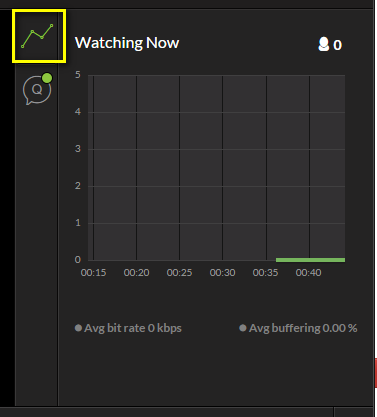
The Analytics window is displayed on the right side of Kaltura Webcasting Application. Click the icon to open the Analytics pane. To show or hide the analytics click the Analytics icon or use [Alt + A] keyboard shortcut.
To view the Webcast Analytics
- Click the Analytics icon.

Understanding Live Analytics
The following data appears in the Live Analytics section:
- Number of current attendees in the number on the top right
- Number of live viewers at each point in time during the webcast
Note: if the webcast event is longer than 30 minutes, you may view historical attending data by using the scroller below the graph. - If you scrolled back, you can go back to viewing the last received data by clicking on the top right of the graph.
- Average bit rate – the average bitrate the attendees are viewing in the last minute
- Average buffering –the average buffering time the attendees are experiencing in the last minute

Exporting Live Analytics
To export the Webcasting Analytics
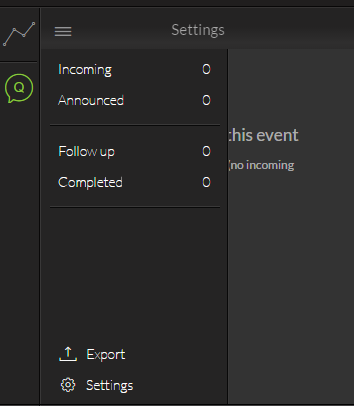
- Click on the Analytics icon to return to the configuration icon.

- Click on Export.


