Overview of Webcasting Entry Level Analytics
The Webcasting Entry Level analytics dashboard enables you to discover how your users engage with a specific Webcasting entry, where they watched it from and with what devices, so you can track and optimize your live events. You can also filter based the analytics based on a variety of parameters, including location and category. To learn more, see Working with the Entry Level Analytics Dashboard.
As a reference for analytics terms and definitions, please see the Advanced Analytics Terminology article.
To access Entry Level analytics in Rich Media CMS
- Select the Content menu and then select Entries.
- Click on the desired Webcasting entry.
- Click View Analytics.
Analytics are also available for image files.
The top panel of the Webcasting Entry Level dashboard provides an overview with highlights and details on the specific webcast entry.
Details
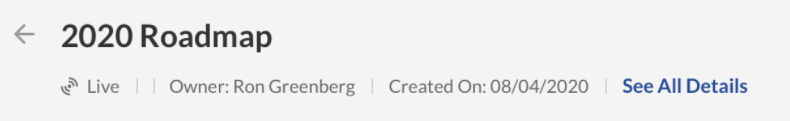

- Entry Type
- Entry owner
- Created On
- (Rich Media CMS) Link to the Entry Details page
Summary
Displays a snapshot of the important metrics for the selected time-frame.
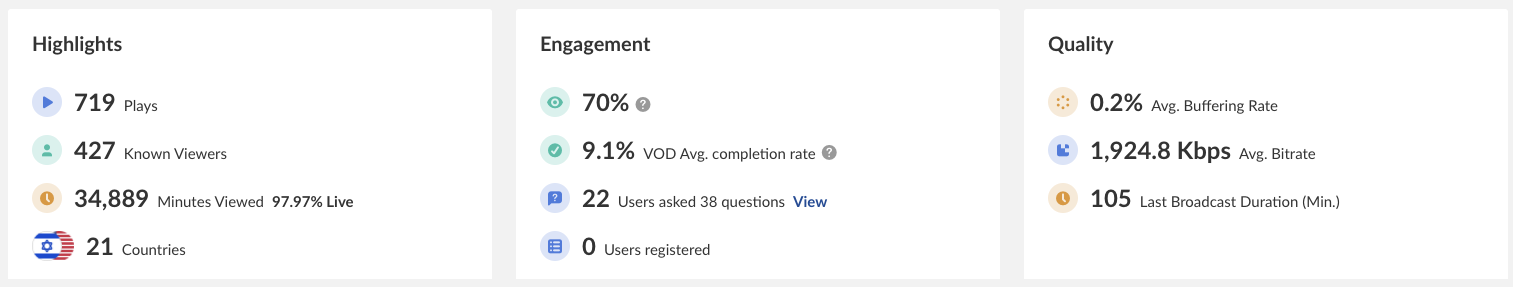
Highlights
- Plays - the number of times the player started to play,
- Known Users - the total number of viewers that saw the webcast. This number is especially interesting if the content is opened for non logged in viewers.
- Minutes Viewed - total number of minutes that all the viewers have watched, in the details you can find how much of the total time viewed was during the live broadcast as apposed to the VOD recording of the webcast.
- Countries - total number of countries that all the viewers came from.
Engagement
- Live Engagement Rate - The rate of the time that viewers watched the broadcast either in full screen or with the tab in focus and the player's sound on.
- VOD Avg. Completion Rate - How much of the VOD recording was watched,
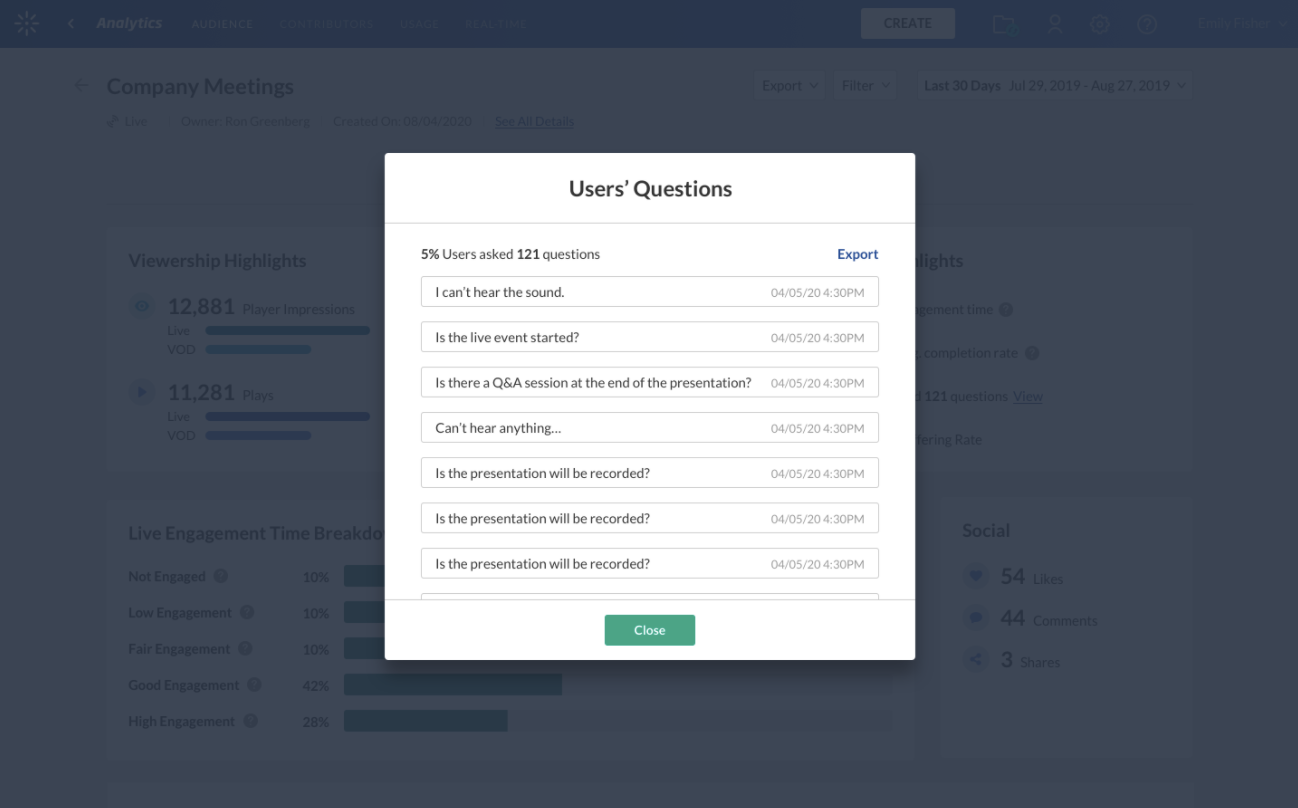
- Q&A - The rate of viewers that asked questions and the total number of questions. In addition, you can also view all the questions that were submitted by clicking on the view link and from there export all the questions.
- Registration - The total number of registered users. When analytics is viewed from within KMS, an option to download the Registration report is available.

Quality
- Avg. Buffer Rate - The rate of buffering out of the total broadcast From the total amount of time viewed, the percent of time the player was buffering.
- Avg. Bitrate - The average bitrate viewed by all the viewers. Indicates the quality of the video watched. Kaltura Player sends a beacon every 10 seconds with the viewed bitrate. The average bitrate is the average reported bitrate across all players. (sum of bitrate /number of view events with reported bitrate)
- Last Broadcast Duration - The total broadcast time of only the last broadcast.
Engagement
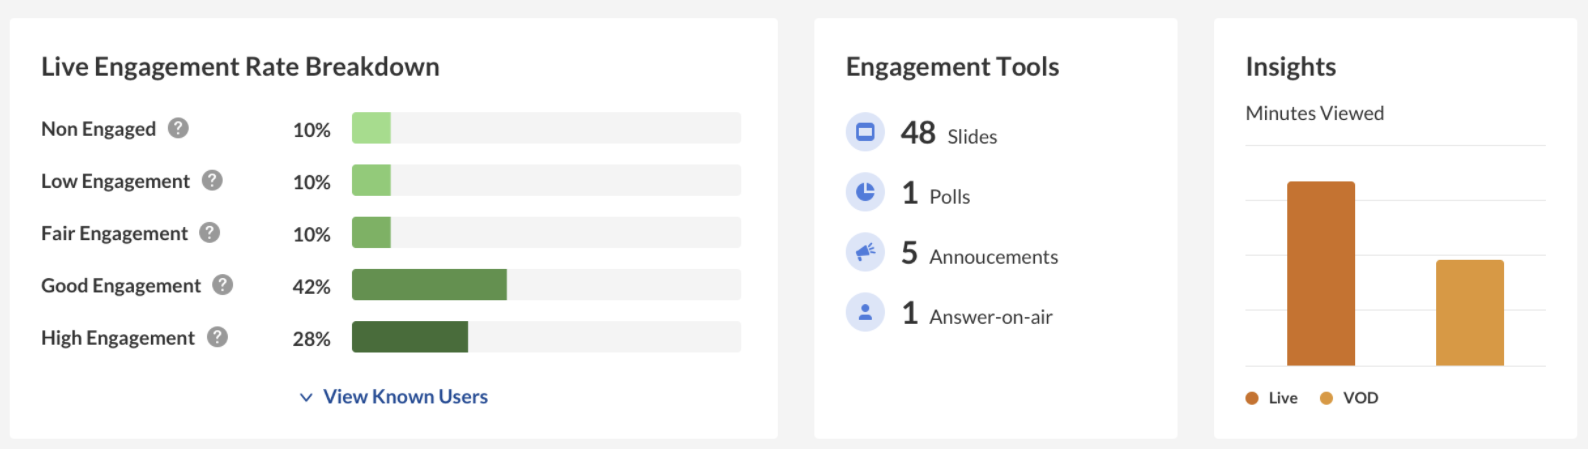
Live Engagement Rate Breakdown
- Non Engaged - Tab is not in focus, Player is on Mute
- Low Engagement - Tab is in focus, Player is on Mute
- Fair Engagement - Tab is not in focus, Sound is On
- Good Engagement - Tab is in focus and Sound is On
- High Engagement - Tab is in focus, Player is in full screen mode, Sound is On.
Clicking on View Known Users will auto scroll and focus the browser to the users list sorted by the engagement rate.
Engagement Tools
Displays (per tool) how many times the tool was used during the webcast.
Insights
Displays the minutes viewed broken down to Live vs VOD recording.
Views on Playback
In this section you can see the number of VOD views and Live Engagement over the duration of the entry per minute. Through this parameter you can understand which sections of the video generated interest and when you lost your audience.
Note: When using DVR, the Live engagement rate will not show data or it will show flat line.
Because this is a live entry, Views on Playback will react to the Webcast's state. The webcast has the following states:
- Live
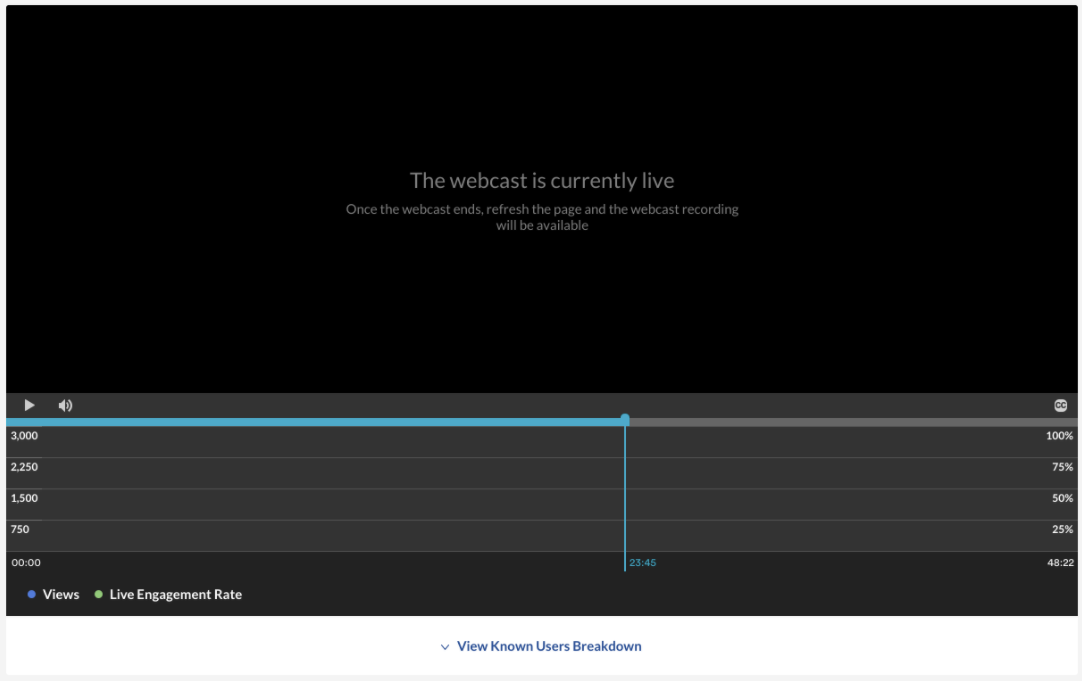
- Offline with no recording - Either the recording has never been broadcasted, or the recording has been disabled for the entry.
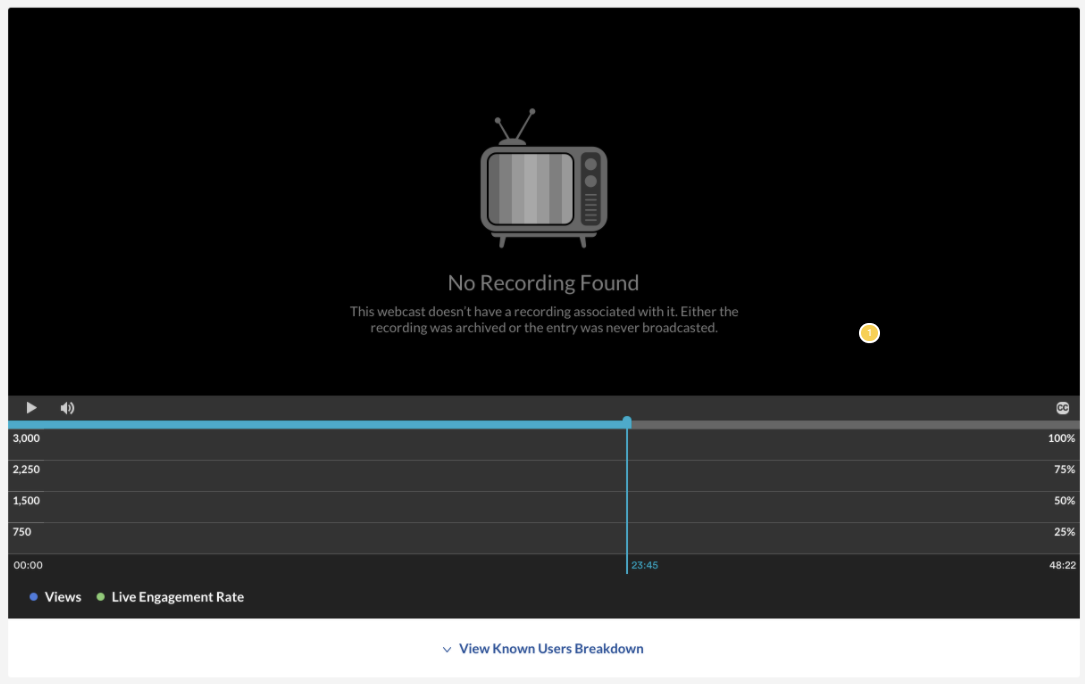
- Offline with recording
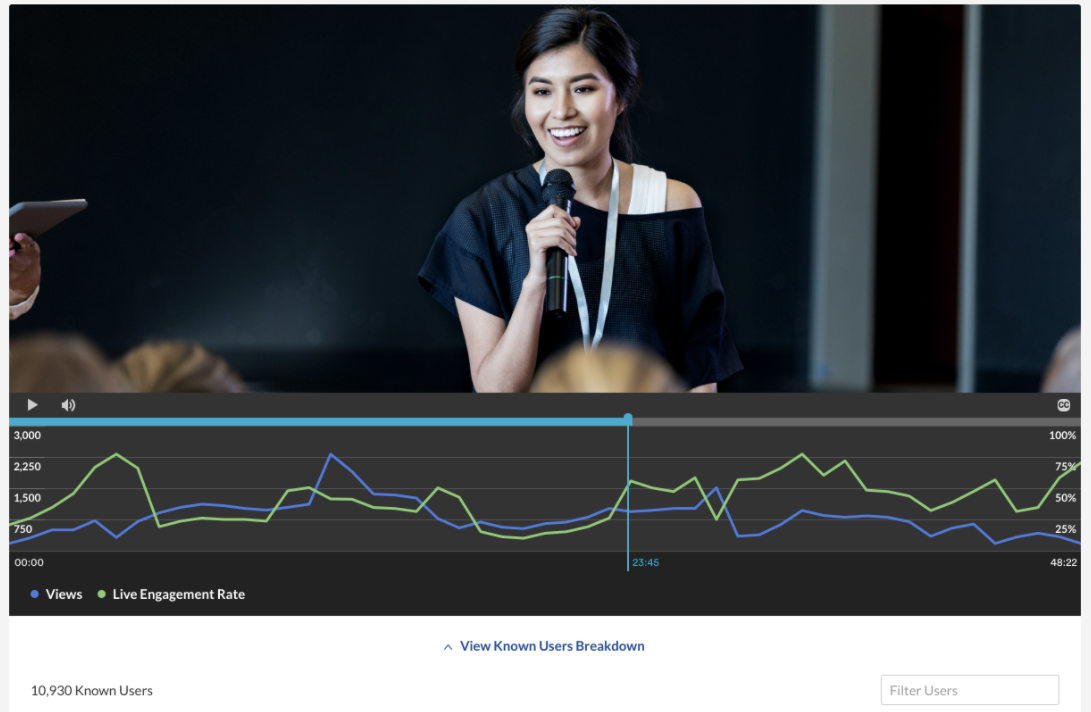


User Engagement
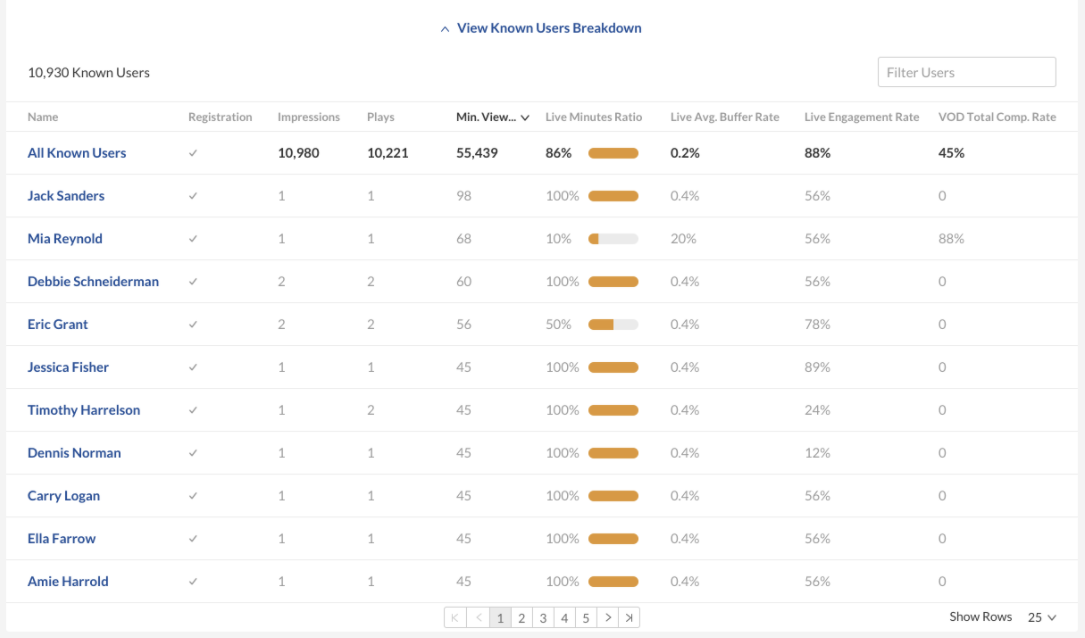
Click "View Known Users Breakdown" under the player graph to see an in-depth analysis of all users that viewed this entry.
The following information is displayed for each user:
- Registration
- Impressions
- Plays
- Min Viewed
- Live Minutes Viewed
- Live Avg. Buffer Rate
- Live Engagement Rate
- VOD Total Comp. Rate
You can also filter by specific users, using the Filter Users field on the top right.
Top Countries
The Top Countries panel ranks the geographical distribution by plays. The heatmap shows the countries, the darker the shade, the more plays for that country. The table displays the following metrics:
- Plays
- Plays distribution
- Known Users
- Minutes Viewed
- Live Avg. Buffer Rate
- Live Engagement Rate
- VOD Avg. Comp. Rate
You can drill down to region by selecting a country on the map or from the table. Select a region to drill down to cities.

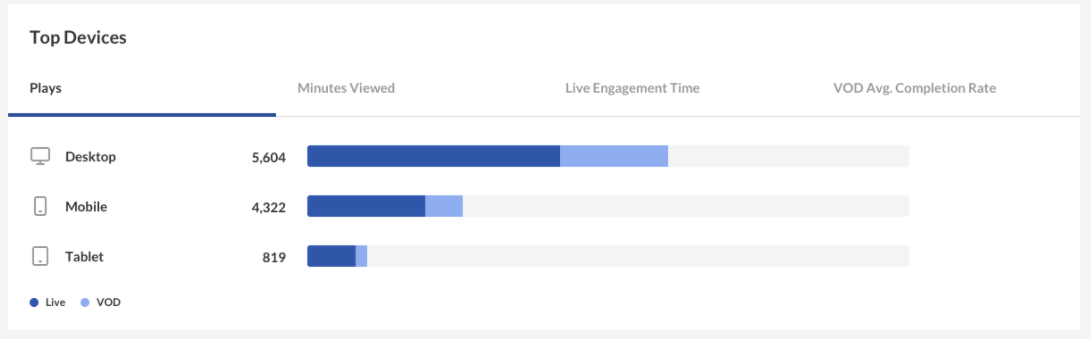
Devices Overview
The Devices Overview displays the viewers distribution of device usage for the following metrics:
- Plays
- Minutes Viewed
- Live Engagement Time
- VOD Avg. Completion Rate
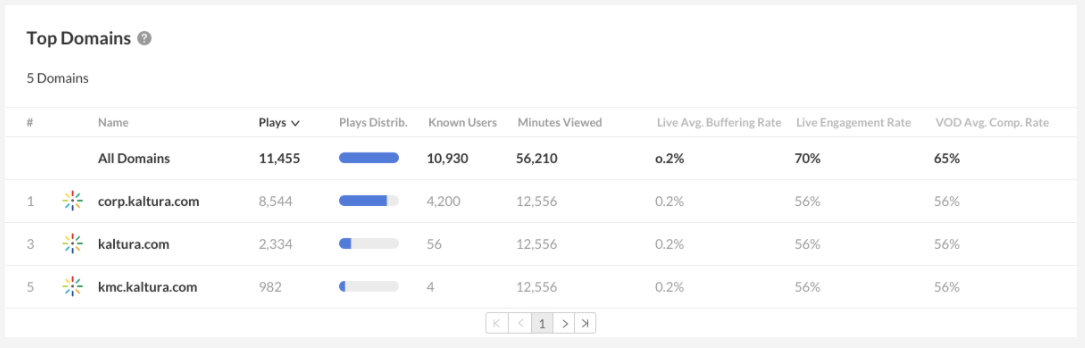
Top Domains
Top domains are ordered by domains that had the most number of plays in the selected time frame. For each domain the following metrics are available:
- Plays
- Plays distribution - number of plays divided by the total number of plays in the selected timeframe.
- Known Users
- Minutes viewed
- Live Engagement Rate
- VOD Avg. Comp. Rate

Minimum Requirements
For all the data to be properly displayed, player versions must be higher than:
- V7.26 (V7 player)
- V2.84 (V2 player)
