Contributors Dashboard
The Contributors dashboard enables you to discover who your top contributors are and how content is created in your account. The dashboard can be used to explore contributions in different time periods and even compare between different periods. You can also filter based on a variety of parameters, including location and category. To learn more, see Working with the Contributors Dashboard.
Contributors are the individuals who add content to your account throughout all your Kaltura applications.
The Contributors' dashboard contains the following sections:
As a reference for analytics terms and definitions, please see the Advanced Analytics Terminology article.

Overview
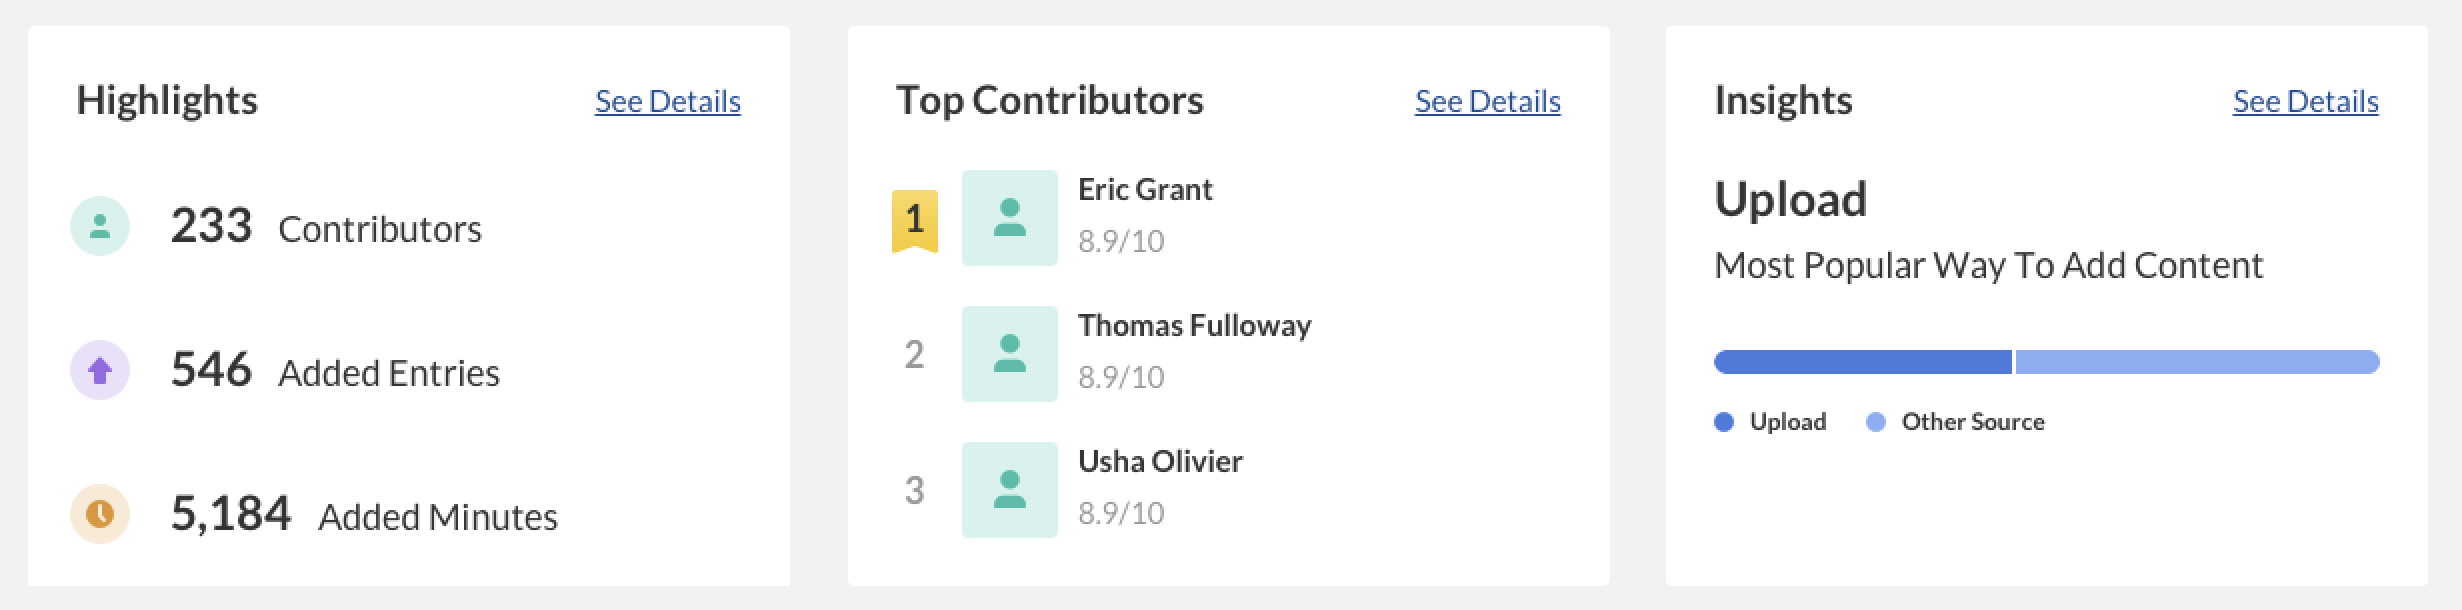
The top panel of the Contributors dashboard provides an overview with highlights and insights on content creation in your account.
- Highlights - Displays a snapshot of the important metrics for the selected timeframe.
- Top Contributors - Displays the top 3 contributors for the selected timeframe. The top contributors are selected based on a unique score that takes into consideration the amount of content created and the viewers engagement with the content.
- Insights - Displays interesting data points about content contribution in your account.

Contribution Metrics Over Time
To explore contribution trends over time, use the graph to review key metrics:
- Number of added entries
- Number of content minutes added
- Number of contributors
Use the tabs at the top of the graph to see the different metrics.

You can view the data for each metric in daily or monthly granularity. Hover over any point in the graph to see the detailed data.
To change the time period or filter the data, use the date picker and filter panel at the top of the dashboard. You can also compare data from different time periods. For more information, see Working with the Contributors Dashboard.
Top Contributors
The top contributors are selected based on a unique score that considers the amount of content created and the viewers engagement with the content. In addition to the contribution score, you can also see the number of entries and total minutes added by each of the contributors. You can also see the total number of plays for each contributors' content, showing how other users are engaging with the created content.

Hover over a contributors' name for additional information about the user.
To change the time period or filter the data, use the date picker and filter panel at the top of the dashboard. You can also compare data from different time periods. For more information, see Working with the Contributors Dashboard.
Contribution Sources
Users can add content to the Kaltura platform in a variety of ways. They can upload files from their computer, use one of the many recording tools, stream live events, and much more. This graph displays how content is added to the platform and the most popular tools for content creation. You can use this information to better understand preferred methods of content creation and adoption of new content creation tools.
To explore the use of content creation sources, use the graph to review key metrics:
- Number of added entries
- Number of content minutes added
- Number of contributors
Use the tabs at the top of the graph to see the different metrics.

Hover over any point in the graph to see the detailed data.
To change the time period or filter the data, use the date picker and filter panel at the top of the dashboard. You can also compare data from different time periods. For more information, see Working with the Contributors Dashboard.