About
This article describes how to view analytics across your events.
Access the Analytics page
1. Clicking All re-directs you to the Kaltura Virtual Events Home page. In the image below, notice the All button located at the top left corner of Event page. The user can simply click the All button to return to the Kaltura Virtual Events Home page.

The Home tab is the default open tab upon navigating to the Kaltura Virtual Events Home page.

2. Click the Analytics tab.
The Analytics page is only available to account owners/admin.

Section descriptions
The first portion of the page (shown above) provides information on highlights, top videos, and insights. This allows you to gain insight into your event highs and lows.
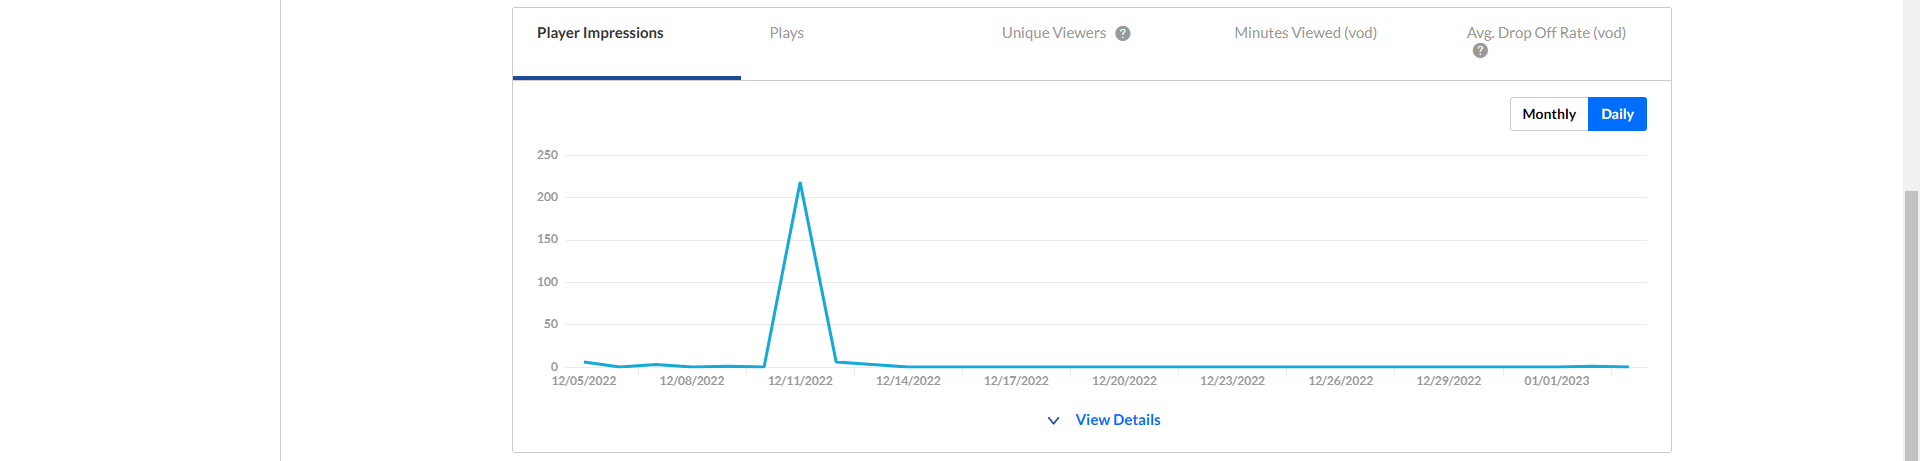
The second portion (shown below) provides information on player impressions (a player impression event is counted each time the player is loaded on the page), plays (a play is counted when a user clicks the Play button to watch a video; if the player is set to auto-play, a play event will be counted when the player begins to play the video), unique viewers (number of unique users that had an active viewing action during the time period), minutes viewed (minutes played across all viewers), and average drop off rates (the average percentage of drop-off quartile (last quartile watched), across all plays).
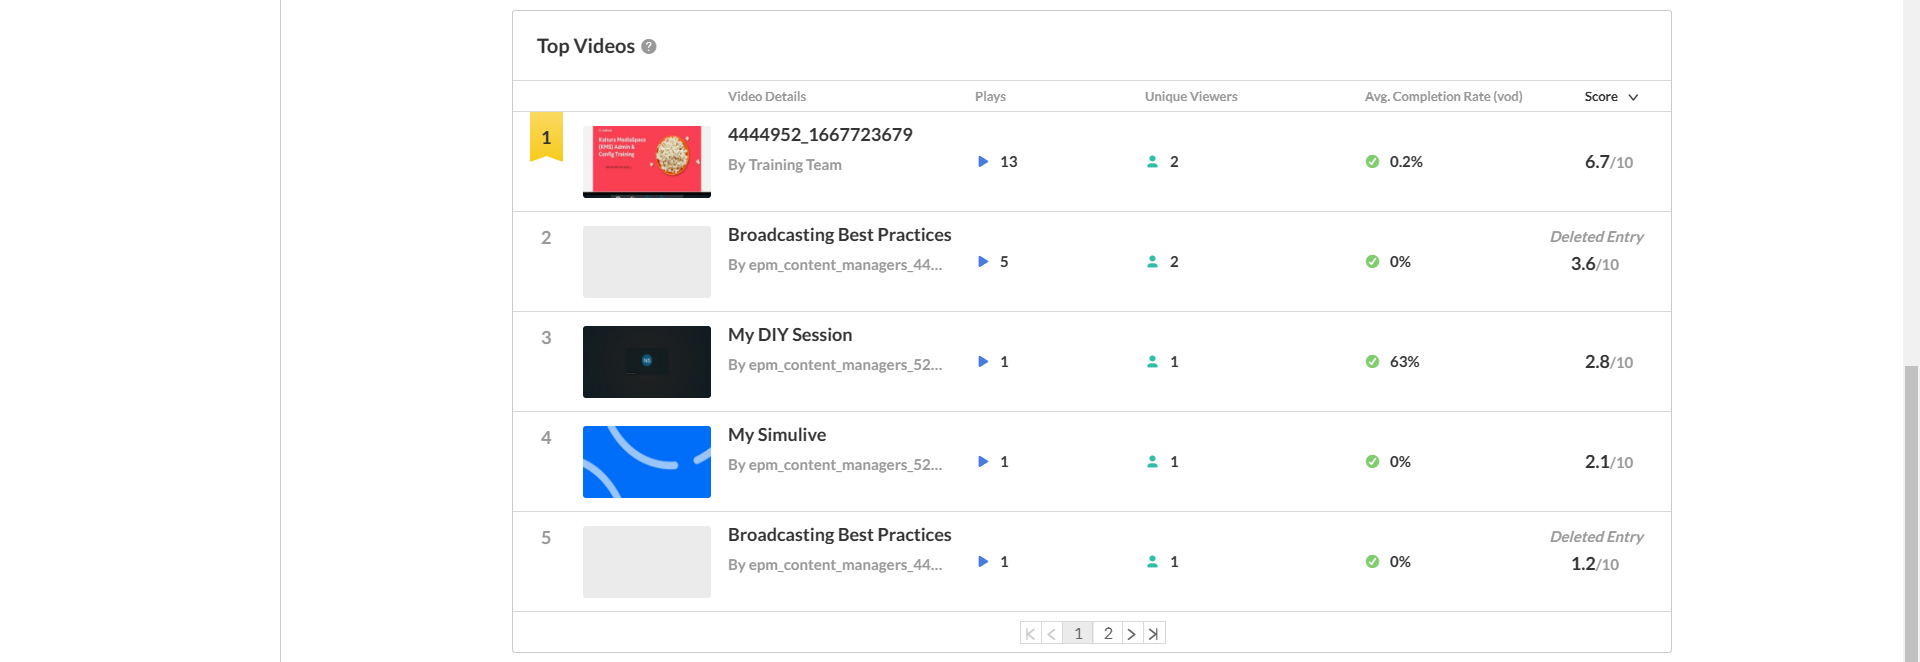
The third portion (shown below) focuses on top videos. Get measurable data to prove ROI and apply personal and organizational KPIs.
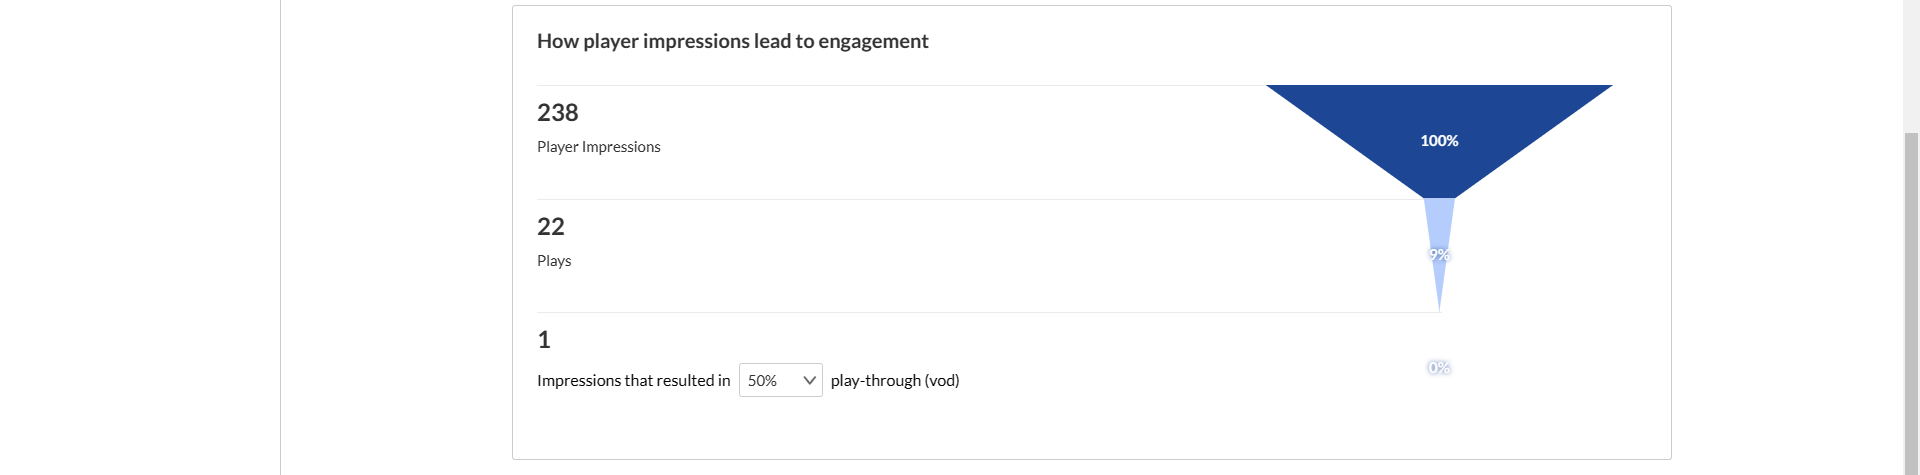
The fourth portion (shown below) provides information on how player impressions led to engagement. This includes player impressions, plays, and impressions that resulted in [number]% play-through (VOD) (pull down menu allows you to select percentage).
💡You may also perform the following additional functions on the Analytics page:
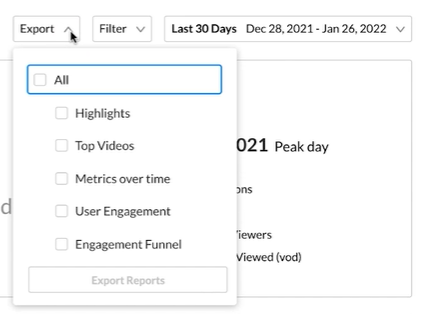
Export specific analytics
Export reports and share with colleagues.
Filter by several different data points
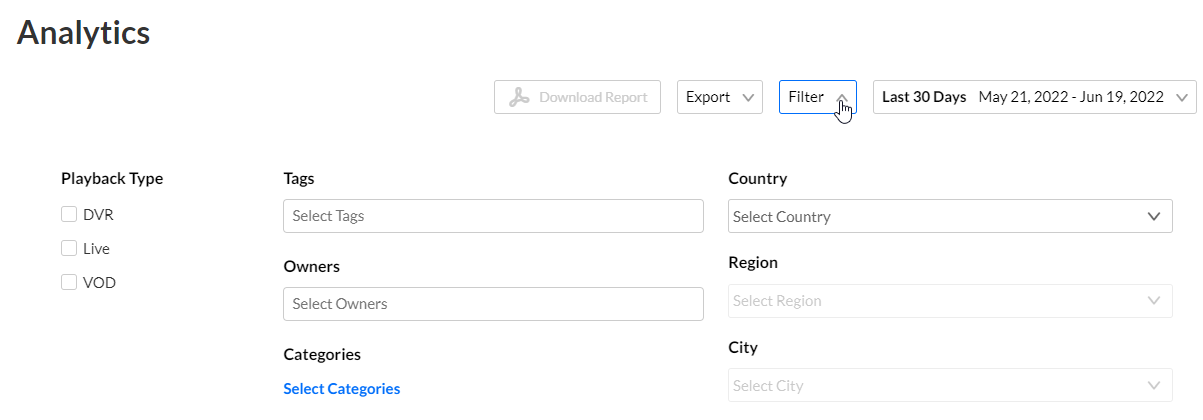
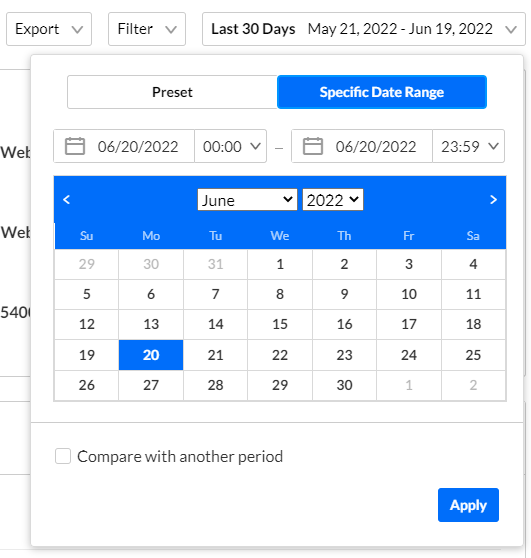
Sort based on specific dates or time
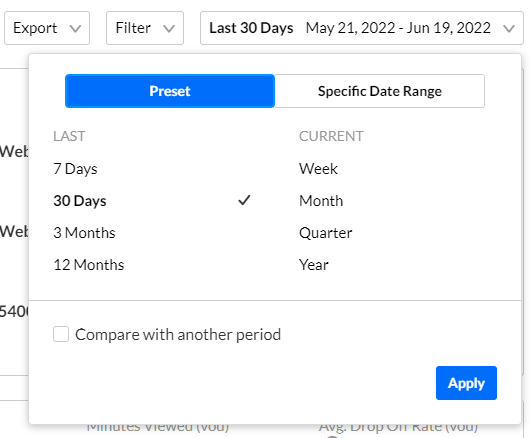
Compare data from one period to another
Compare sessions and event across any time frame to learn about what was most engaging.
Download report
You may click the Download Report button to download a PDF version of the dashboard.
