About
This article describes how to view analytics on your session once it is over.
This article pertains only to multi-session events.
View analytics after the session ends
- Navigate to the Agenda page.
There are two ways to reach the Agenda page:- By clicking Full agenda on the Agenda at a glance section of the Event Overview page.
- By clicking the Agenda tab.
The Agenda page displays.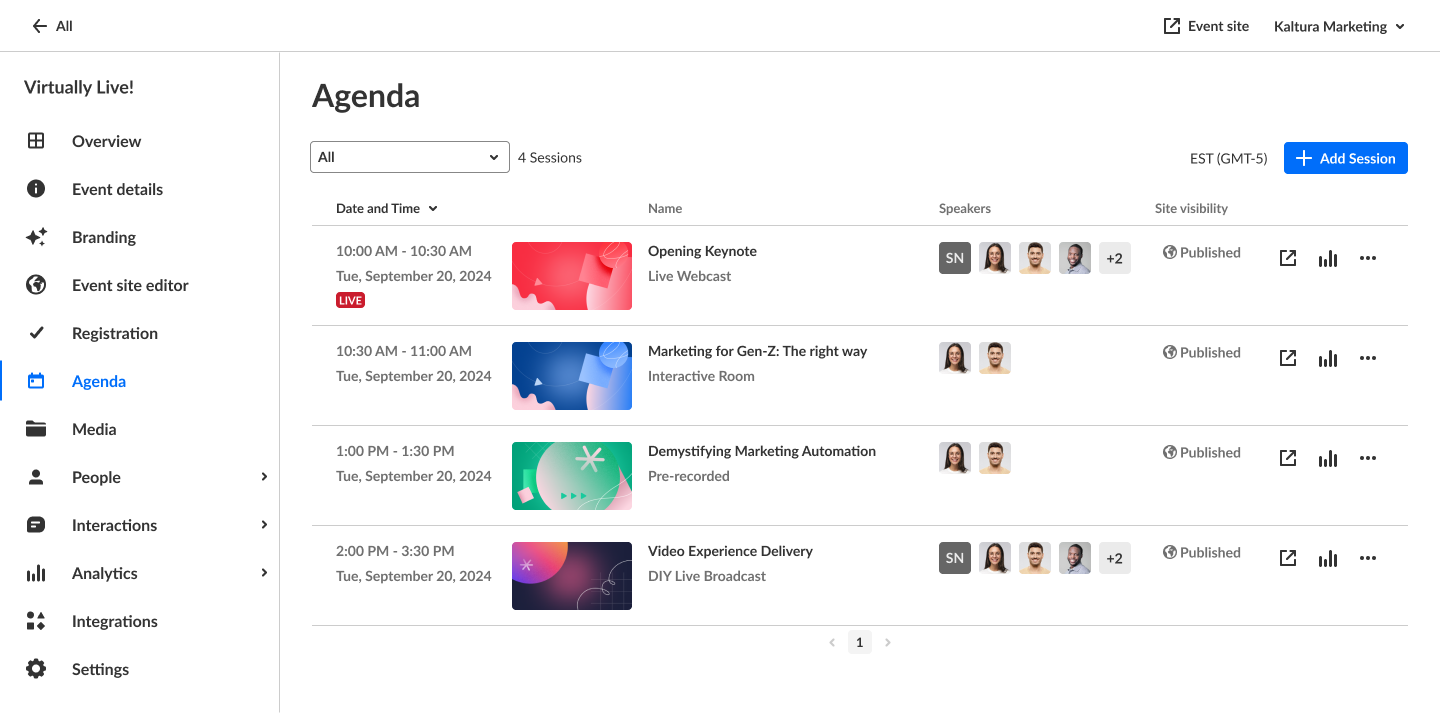
- Click the analytics button to the right of the session.
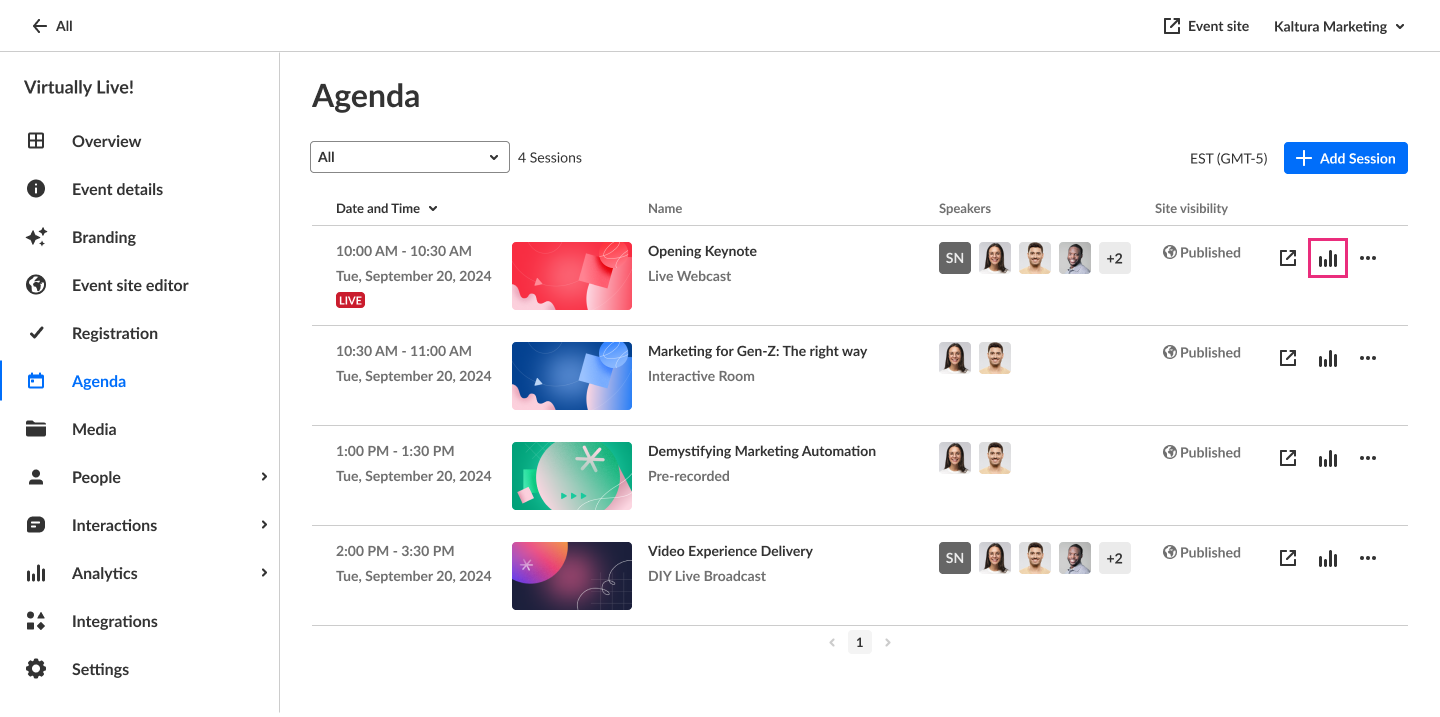
In the following example, we are viewing analytics for a Live entry.
The first portion of the page provides the following information:
Unique viewers - Number of unique users that viewed the live session or the recording.
Average minutes viewed - Average number of minutes viewed per viewer.
Live engagement
- Average live engagement rate - Average engagement rate of all users during the session.
- Sent live reactions - Percentage of users that sent one or more reactions during the live session and the number of reactions sent in the session.
Kaltura limits the number of reactions a user can trigger to within a few seconds. This not only maintains focus on content and avoids noise and distortion during a session, but it also ensures integrity of data on user reactions.
- Sent messages on group chat - Percentage of users who sent messages on the group chat and total number of group chat messages sent in the session.
- Participation in polls - Percentage of users who participated in polls.
- Q&A threads created - Percentage of users who created Q&A threads and total number of Q&A threads opened in the session.
- Attachments downloaded - Percentage of users who downloaded attachments and total number of downloads of session attachments.
Recordings plays - Number of times that the recording started playback.

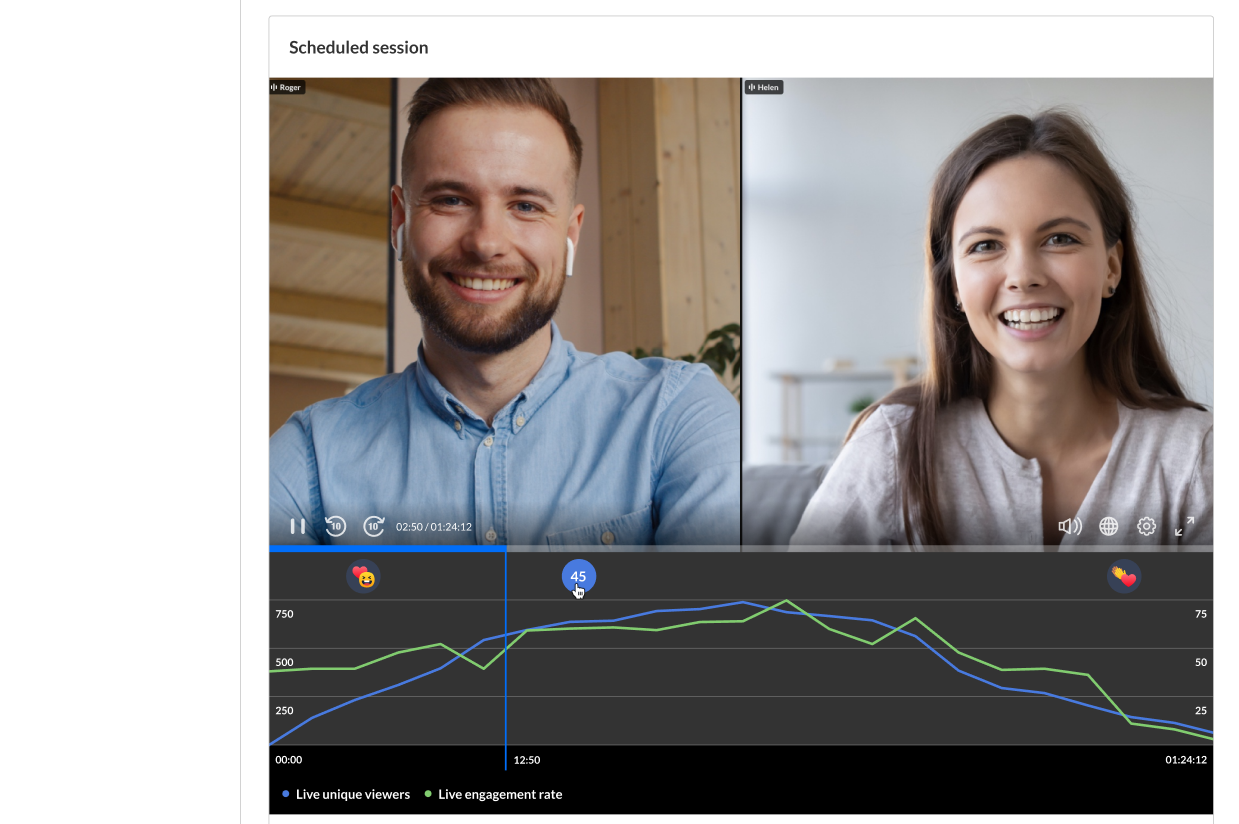
The next portion focuses on live unique viewers and live engagement rate.
Live unique viewers (blue line) - Number of users at each point of the session (compare to numbers on the left side).
Live engagement rate (green line) - Average live engagement rate across all users in the session at each point (compare to percentages on right side). Use this data to spot the most engaging moments in the session.
Note the points in the session that received the highest reaction rates. Engagement and reactions are synced with the session's playback.
The next portion provides information on viewer engagement.
If you'd like to search for a specific attendee in the list, type at least three letters of the attendee's name in the search field, then click the search "magnifying glass" icon or simply press Enter on your keyboard.

Information in this portion of the page includes the following:
Name - Name of attendee, including title and company.
Quick tip - You may click on the name to navigate to the Events user dashboard.
Hover over the name to display complete user information, including name, role, company, industry, and country.

Minutes viewed - Number of minutes viewed per user.
Reactions - Number of reactions sent by the user over the course of the live session.
Sent chat messages - Number of chat messages sent by the user over the course of the live session.
Polls answered - Number of polls answered by the user over the course of the live session.
Live engagement rate - Average engagement rate of the user during the session.
Note the heatmap for each viewer. The darker color shade indicates higher engagement. Viewers who are considered to be highly engaged have the tab in focus, are watching in full screen, and/or have the sound on. The lighter color shade indicates lower engagement. Viewers who are considered to be less engaged may not have the tab in focus, are not watching the full screen, and/or have the player muted.
Additional information is displayed under the heatmap - number of Q&A threads created by the user, number of times the user downloaded an attachment, and number of times user raised their hand.

The next portion provides analytics on polls that were initiated during the session.
In our example below, 5 polls were launched during this session. This screen displays all the poll questions, the poll types, and the number of unique participants that answered each poll.
You may download a PDF of all questions.

You may click on a poll question to drill down and view additional information about that question.
In our example below, we have clicked on the question "How many Hackathons were hosted in Kaltura?" The poll type, the number of possible answers (not applicable for open ended questions), and the number of unique participants that answered the poll are all displayed.
In the Answers column, each possible answer to the question is listed.
In the Unique participants column, the number of participants who gave each particular answer is shown.
In the Rate column, a percentage of unique participants who gave each particular answer is shown. This percentage is calculated by dividing the number of unique participants that gave that answer by the number unique participants that answered the poll.

The next portion provides information on recordings with plays over time.
Recordings - Number of times that the recording started playback.
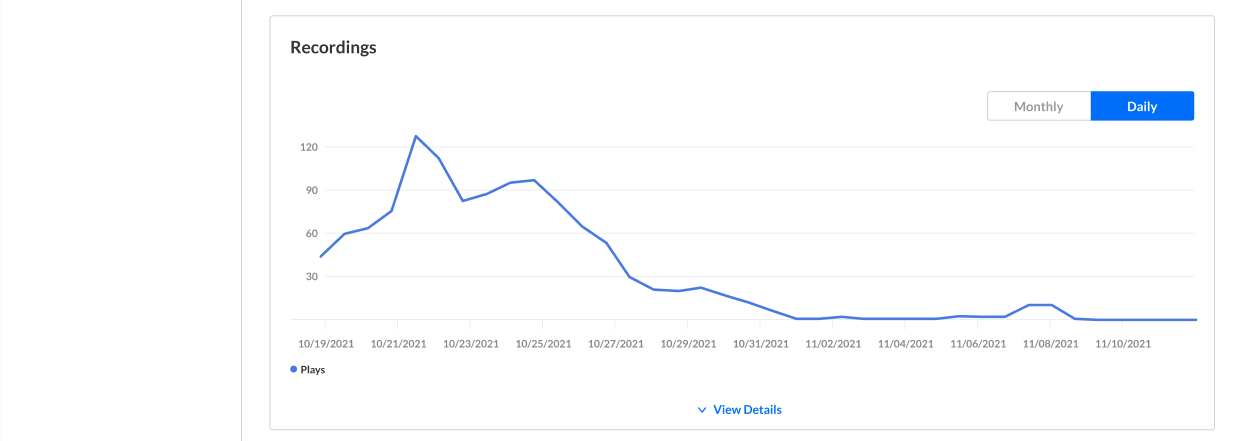
Press View Details to view additional details about the recordings.
Impressions - Number of times the user loaded the player.
Plays - Number of times the user started playback on the player.
Minutes viewed - Number of minutes viewed by the user.
Average completion rate - Average completion rate of the video over all plays. Each percentile viewed by the user in each play is counted and summed up. Then this number is divided by the number of plays that the user had.

The next section allows you to discover from where your attendees watch the session (live or for the VOD experience).
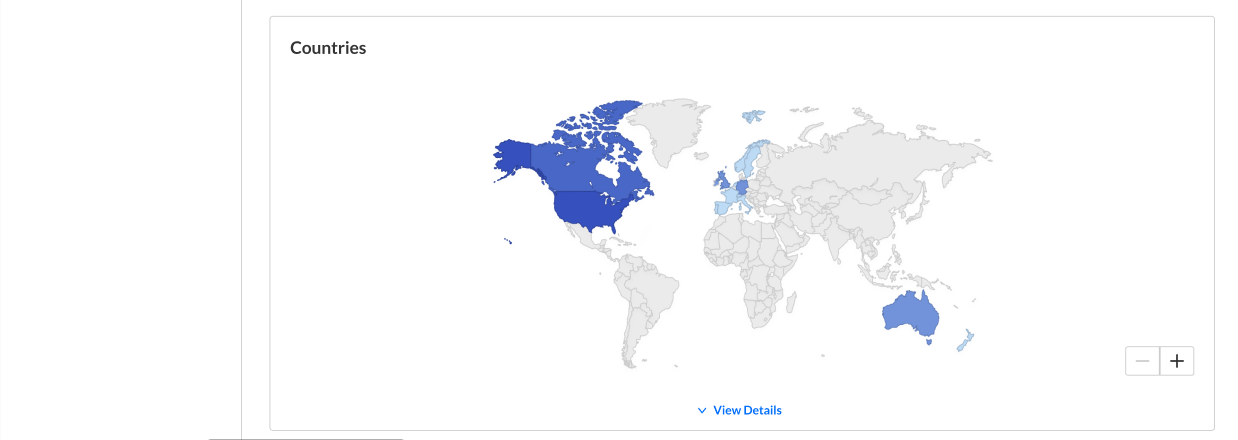
Press View Details to view additional details about the countries.
Live unique viewers - Number of unique viewers that watched the live session (live or meeting) from the country.
Recording unique viewers - Number of unique viewers that watched the recording from the country.

The next section allows you to see on which devices your session was watched (live or for the VOD experience).
Live unique viewers - Number of unique viewers that watched the live session (live or meeting) on the device.
Recording unique viewers - Number of unique viewers that watched the recording on the device.

Export report to email
You have the option to export to a CSV.
- Click the Export button.
You receive notification that you are about to export and email the report to yourself.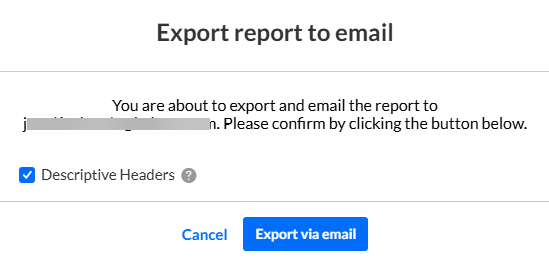
- Click to select the Descriptive Headers checkbox if you would like descriptive ("friendly" and meaningful) report header titles as part of the report, as opposed to system ("non-friendly") report header titles.
- Click Export via email.
You receive an email with a link to download the file.
The file emailed to you expires in 7 days.
Please see Viewer engagement report for definitions of each metric, along with its method of calculation.
Download report
Click the Download Report button to download a PDF version of the dashboard.


