About
You can view analytics for sessions held in the Kaltura Room right from your application. This data gives you insights into participation and engagement, whether you're running live meetings, breakout discussions, or ongoing collaboration sessions.
You can access analytics for rooms launched from:
- Standalone media entries (accessed via the 'Join Room' button on a media page)
- Channel rooms
- These analytics reports are not supported for legacy meeting rooms.
- This feature requires the Theming module to be enabled with the 'analytics' feature set to 'Yes'.
Access the analytics
Via the media page
- Navigate to the desired media page.
- Once you're on the media page, click the three-dot menu below the player.
- From the menu options, select Analytics.


Via My Media
- Access your My Media page.
- On your My Media page, locate the relevant entry.
- Click the three-dot menu to the far right and select Analytics.
If you don't see this option in your menu, reach out to your Kaltura administrator.

The room analytics dashboard displays.

Room analytics dashboard
Overview
The first portion of the page provides the following information:
- Unique viewers - Number of unique users that viewed the live session or the recording.
- Average minutes viewed - Average number of minutes viewed per viewer.
- Live engagement
- Average live engagement rate - Average engagement rate of all users during the session.
- Sent live reactions - Percentage of users that sent one or more reactions during the live session and the number of reactions sent in the session.
Kaltura limits the number of reactions a user can trigger to within a few seconds. This not only maintains focus on content and avoids noise and distortion during a session, but it also ensures integrity of data on user reactions.
- Sent messages on group chat - Percentage of users who sent messages on the group chat and total number of group chat messages sent in the session.
- Participation in polls - Percentage of users who participated in polls.
- Q&A threads created - Percentage of users who created Q&A threads and total number of Q&A threads opened in the session.
- Attachments downloaded - Percentage of users who downloaded attachments and total number of downloads of session attachments.
- Recordings plays - Number of times the recording started playback. Click See more to view further details.
Live unique viewers and live engagement rate

- Live unique viewers (blue line) - Number of users at each point of the session (compare to numbers on the left side).
- Live engagement rate (green line) - Average engagement rate across all users at each point. Use these lines to spot the session’s most engaging moments - reactions and engagement stay synced to the playback.
Viewer engagement

Search for a specific attendee by typing at least three letters of their name in the search field, then click the magnifying glass icon or press Enter on your keyboard.

Information in this portion of the page includes the following:
- Name - Hover to display complete user information, including name, role, company, industry, and country.

- Minutes viewed - Number of minutes viewed per user.
- Reactions - Number of reactions sent by the user over the course of the live session.
- Sent chat messages - Number of chat messages sent by the user over the course of the live session.
- Polls answered - Number of polls answered by the user over the course of the live session.
- Live engagement rate - Average engagement rate of the user during the session.
Heatmap - The darker color indicates higher engagement (tab in focus, are watching in full screen, have the sound on). The lighter color indicates lower engagement (tab not in focus, not full screen, player muted).
Additional information is displayed under the heatmap - number of Q&A threads created by the user, number of times the user downloaded an attachment, and number of times user raised their hand.
Interactions
This section provides analytics for interactions created during the session, such as polls, quizzes, and rating scales. The table lists each interaction, including its type and the number of unique participants who responded.
You can download a PDF of all interaction questions.
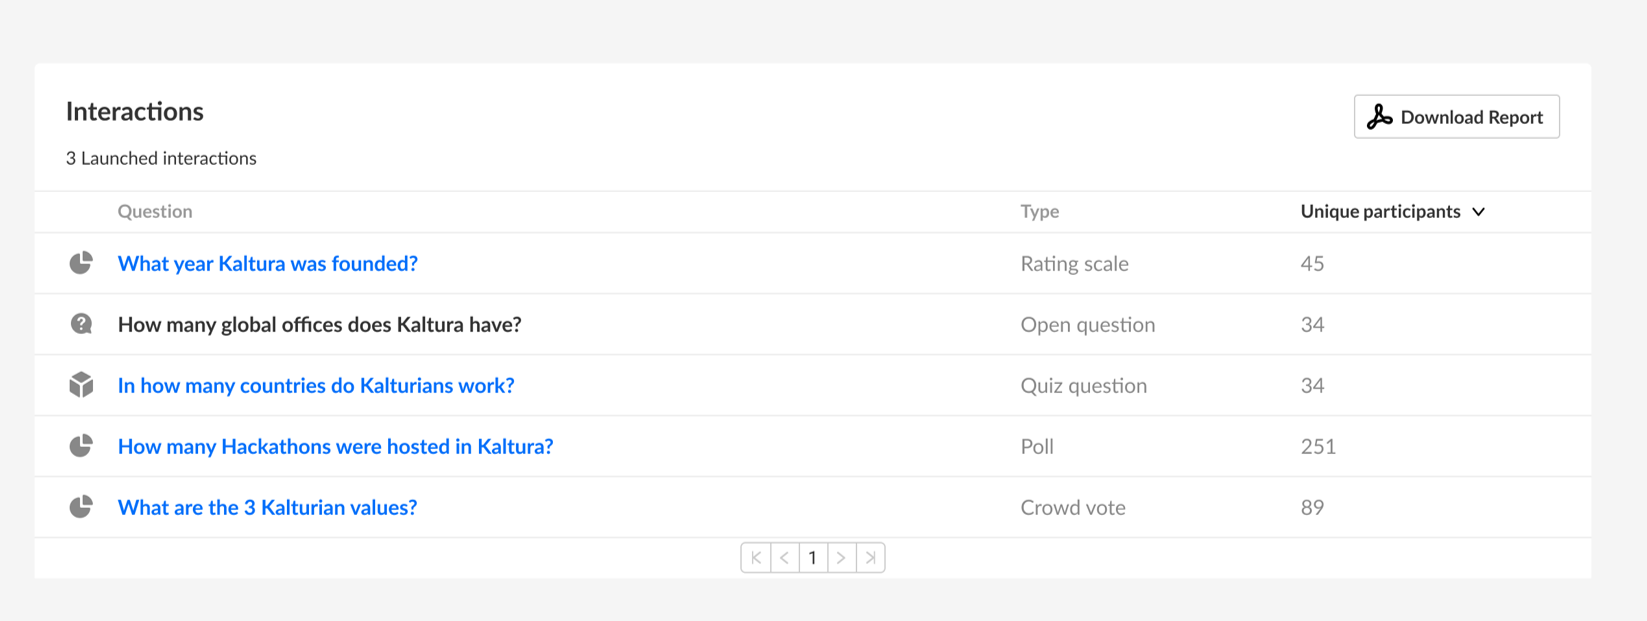
Click an interaction question to view additional details, as follows:
- Interaction type – The type of interaction.
- Possible answers – The available answer options (not applicable for open-ended questions).
- Unique participants – The number of participants who responded to the interaction.
In the Answers column, each possible answer is listed.
In the Unique participants column, the number of participants who selected each answer is shown.
In the Rate column, the percentage of participants who selected each answer is displayed. This percentage is calculated by dividing the number of participants who selected a specific answer by the total number of participants who responded to the interaction.
 Example of a rating scale interaction showing participant responses
Recordings
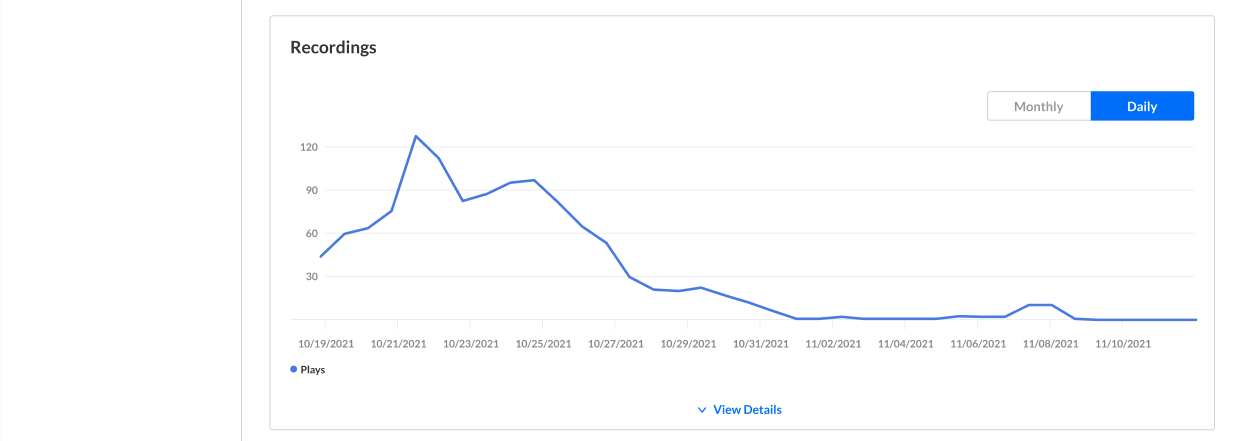
Recordings - Number of times that the recording started playback.
Click View Details to view additional details about the recordings:
- Impressions - Number of times the user loaded the player.
- Plays - Number of times the user started playback on the player.
- Minutes viewed - Number of minutes viewed by the user.
- Average completion rate - Average completion rate of the video over all plays. Each percentile viewed by the user in each play is counted and summed up. Then this number is divided by the number of plays that the user had.

Countries
See where your attendees joined from (live or VOD).
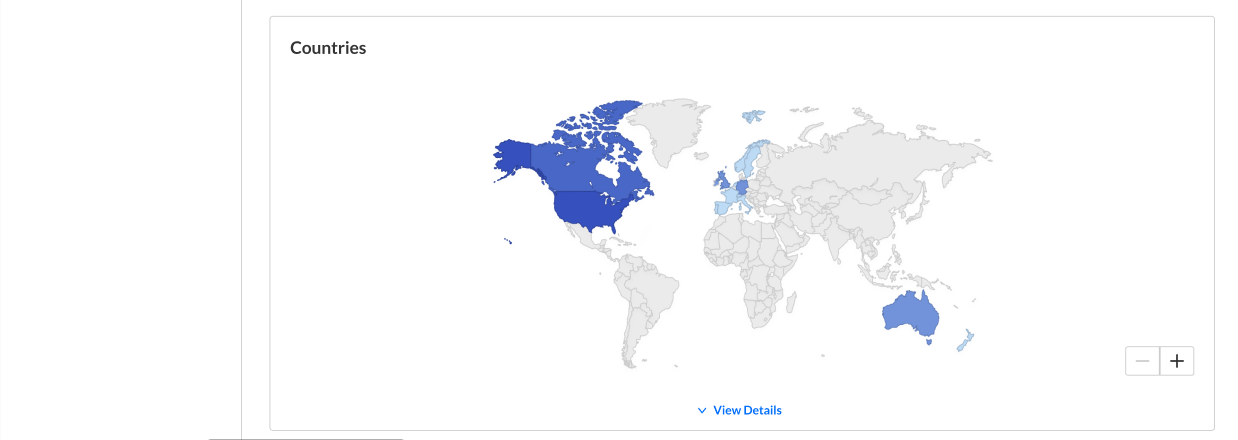
Click View Details to view additional details about the countries.
- Live unique viewers - Number of unique viewers that watched the live session (live or meeting) from the country.
- Recording unique viewers - Number of unique viewers that watched the recording from the country.

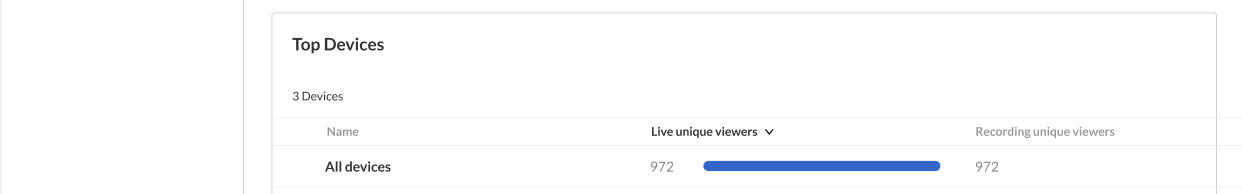
Top devices
See which devices viewers used (live or VOD).
- Live unique viewers - Number of unique viewers that watched the live session (live or meeting) on the device.
- Recording unique viewers - Number of unique viewers that watched the recording on the device.
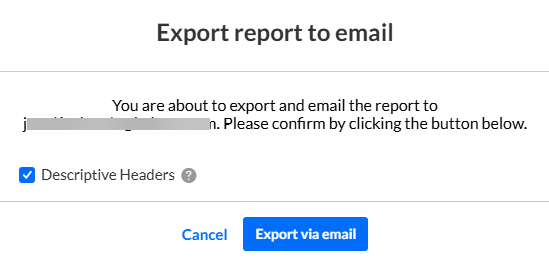
Export report to email
- Scroll to the top of the page and click the Export button at the far right. You receive notification that you are about to export and email the report to yourself.
- Select Descriptive Headers if you want friendly column names.
- Click Export via email. You receive an email with a link to download the file.
The file emailed to you expires in seven days.
Please see Viewer engagement report for definitions of each metric, along with its method of calculation.
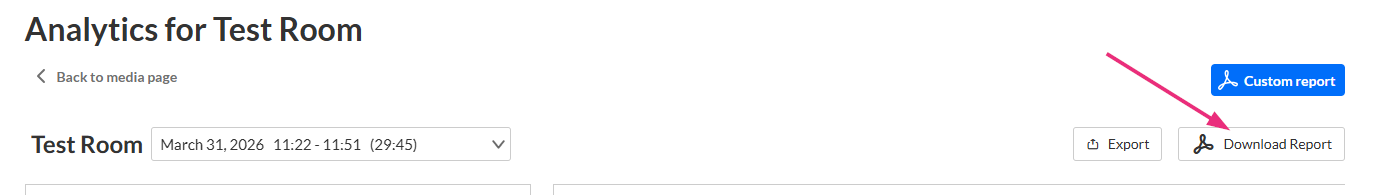
Download a PDF
At the top of the page, click the Download Report button. A session summary is generated and downloaded in PDF format.
Custom reports
Click the Custom report button.
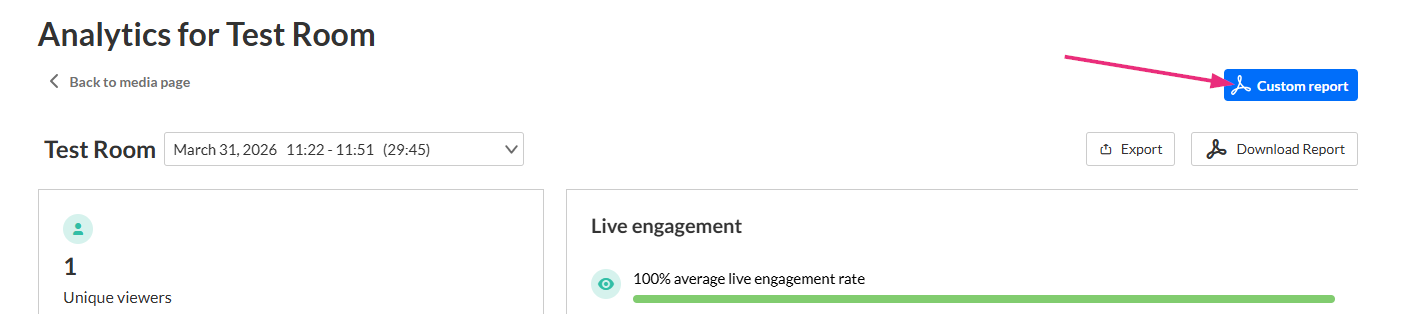
The 'Custom Report' window opens.

The following types of reports are available:
Group chat transcripts
This report provides the full transcript of group chat messages from sessions. Use it to review conversations, track participation, and analyze chat activity.
Key details include:
- userId - A unique ID of the user who sends the message in the group chat.
- userFirstName - The first name of the user who sent the message.
- userLastName - The last name of the user who sent the message.
- userEmail - The email of the user who sent the message.
- userRole - The role of the user who sent the message.
- messageId - A unique ID of the message.
- sentAt - The time the message was sent at.
- message - The content of the message.
- repliedToMessageId - The ID of the message this message was replying to (will be filled only if it was a reply message).
- likes - The number of likes the message received.
- Whether the message was deleted
- Sub-context (for example, breakout or chat context)
This report helps administrators review chat discussions and understand how participants interacted during a session.
Chat moderation data
This report provides insight into chat moderation activity during sessions. Use it to understand how moderators managed conversations and handled chat threads.
Key details include:
- Context ID and context name (the room or session where the chat occurred)
- Last activity timestamp
- Number of pending threads
- Number of owned threads
- Number of resolved threads
- Number of completed (done) threads
- Total user messages
- Total moderator messages
- Moderators owning resolved threads
- Moderators owning unresolved threads
This report helps administrators monitor moderation workload and review how chat discussions were managed during sessions.
Room data
This report gives you an overview of session-level activity. It’s ideal for seeing how each session performed overall.
Key details include:
- Room name and ID
- Session start and end times
- Host information
- Unique users per session
- Engagement rate (based on viewing time)
- Additional filters:
- Specific room IDs (entry_ids)
- Virtual event IDs (virtual_event_ids)
Attendees data
This report drills down into individual user activity during each session. Use it to understand how participants engaged.
Key details include:
- User ID, name, and email
- User role (host, participant, etc.)
- Participation time
- User engagement rate
- Additional filters
- Room ID (entry_ids)
- User ID (user_ids)
- Session ID (cue_point_ids)
- Event ID (virtual_event_ids)
Breakout room sessions
If your sessions include breakout rooms, this report provides details on each one, grouped by the main room.
Key details include:
- Main room and breakout room names and IDs
- Session initiator (host)
- Start and end times
- Duration
- Participant count
- Engagement rate
- Additional filters
- Date range (fromDate, toDate)
- Main room IDs (parentEntryIds)
- Virtual event IDs (virtual_event_ids)
Download a report
1. Before downloading a report, you can use the date range drop-down menu to select a timeframe. Choose from:
- Last 7 days
- Last 30 days
- Last 120 days
- Last 365 days
- Custom

If you choose 'custom', use the calendar picker to set exact dates.

2. Choose the desired report.
3. Click Download.
The report downloads as a CSV file.
