About
This article describes how to view registration-related analytics on an event and download a PDF version of the dashboard.
The screens shown here represent a multi-session event. The same actions apply when working with single session.
View registration-related analytics
Navigate to the Registration Analytics page; from the Event page, choose Registration from the Analytics tab pull-down menu.

The Registration Analytics page displays.

The first portion of the page (shown above) provides information on overall turnout, registrants by origin, and registrants over time.
Turnout is the number of attended registrants divided by the number of total registrants. In the example above, 4239 people attended the event divided by 5971 people who registered for the event equals 72% turnout. "Registrants" signify the number of attendees registered for the event. "Confirmed email" signifies the number of attendees confirmed via verification email (only shows for events with verification email enabled). "Attended" signifies those who logged into the event at least once.
Registrants by origin shows how people found and registered for the event - via registration form, webhook, invitation from the admin, via SSO, or if they are admins of the event. Those of each origin who logged into the event are shown in dark blue and those of each origin who didn't log into the event are shown in light blue.
Registrants over time shows the percentage of registrants on each date out of the total number of registrants. In our example above, registration peaked on 10/27/2021. You may use this data to cross-reference peak registration time with registration campaign efforts.
The second portion (shown below) provides information on devices used to fill out the registration form. It shows the percentage of people who filled out the registration form using each device - desktop, mobile, or tablet.

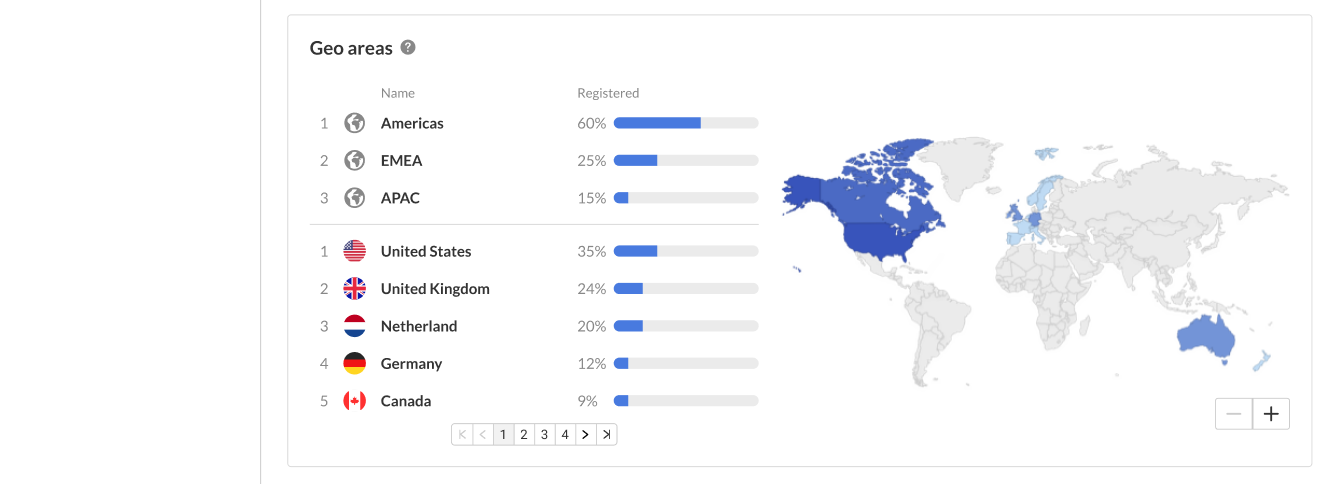
The third portion (shown below) provides information on geographic areas and countries that people listed on their registration forms. This portion does not provide information related to IP addresses.

The fourth portion (shown below) provides information on roles and industries that people listed on their registration forms. Easily view the top roles and industries among registrants and the percentage they represent out of the total number of attendees.

You may also perform the following additional functions on the Registration Analytics page:
Download report
You may click the Download Report button to download a PDF version of the dashboard.
Please see information about the Registration Report here. The Registration Report provides registrants' information from your registration form as well as their current registration status and their registration origin (e.g., registration form, invitation).
