About
Do you invest time in creating great videos? Do you want to know if people are enjoying them or not? Now can easily see the analytics of all the videos you've created with Kaltura's My Analytics.
The My Analytics dashboard enables you to discover how your users engage with a specific entry so you can track and optimize your content. The dashboard can be used to explore engagement in different time periods as well as compare different periods. You can also filter based on a variety of parameters.
My Analytics focuses exclusively on the content you own, ensuring a personalized and relevant user experience.
Access My Analytics
From the user menu , select My Analytics.
If this option is missing from the user menu, ask your administrator using the My Analytics - Admin article.
The My Analytics page displays.
Engagement dashboard
The top panel of the Engagement dashboard provides an overview with Highlights, Top Videos and Insights.
As a reference for analytics terms and definitions, please see the Kaltura Analytics Terminology article.
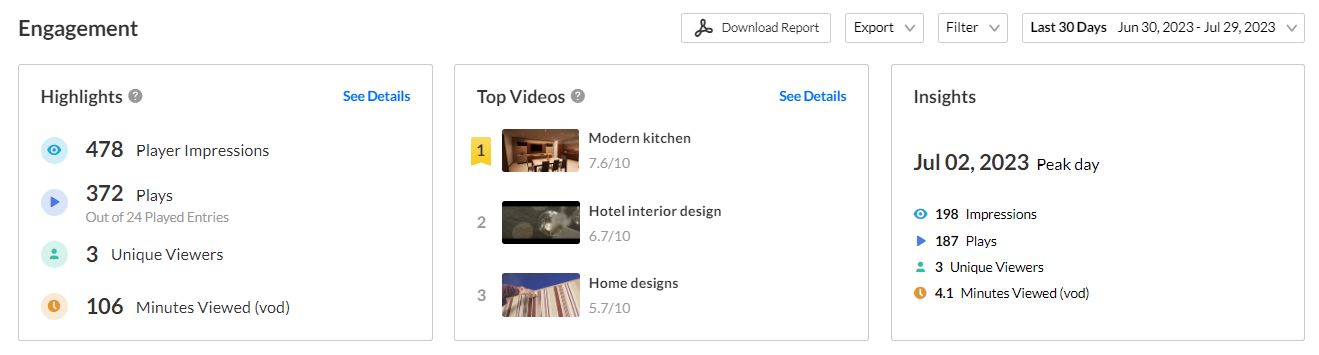
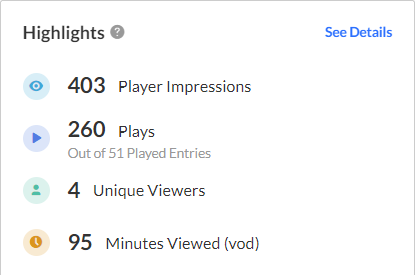
Highlights
Displays a snapshot of the important metrics for the selected timeframe. For each user you will see:
- Player impressions - How many times the video was loaded on the page, regardless of whether the user clicked Play or not.
- Plays - Number of times the Play button was pressed.
- Unique viewers - Number of unique users that had an active viewing action during the time period. Note that Player Impressions are not counted as a viewing action.
- Minutes viewed (VOD) - Minutes played across all viewers.
You can also filter by specific metrics, using the Filter field on the top right.
For more information, see Working with My Content Analytics Dashboard.
Top Videos
The top videos are selected based on a unique algorithm that takes into consideration parameters such as the amount of plays, unique viewers, and average view period and scores them in comparison to other videos in the account.
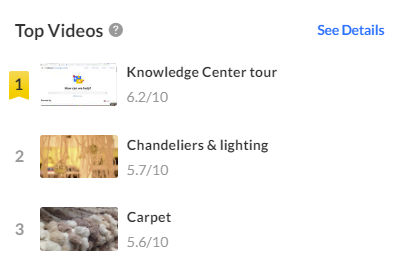
By clicking on See Details in the Top Videos section you can see an in-depth analysis of all the content that was viewed.
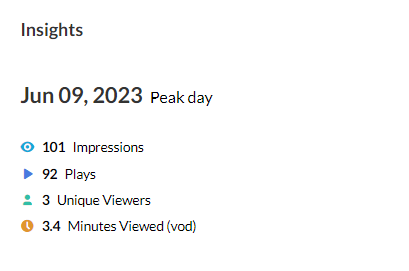
Insights
Displays a snapshot of the important metrics for the day. For each user you will see:
- Impressions - How many times the video was loaded on the page, regardless of whether the user clicked play or not.
- Plays - A play is counted when a user clicks the Play button to watch a video. If the player is set to auto-play, a play event will be counted when the player begins to play the video.
- Unique viewers - Number of unique users that had an active viewing action during the time period. Note that Player Impressions are not counted as a viewing action.
- Minutes viewed (VOD) - Total number of playback minutes played by the viewers, based on quartile milestones. Example: If a user watched 4 minutes from a 10-minute video it will be calculated as 2.5 minutes (25% milestone).
Details
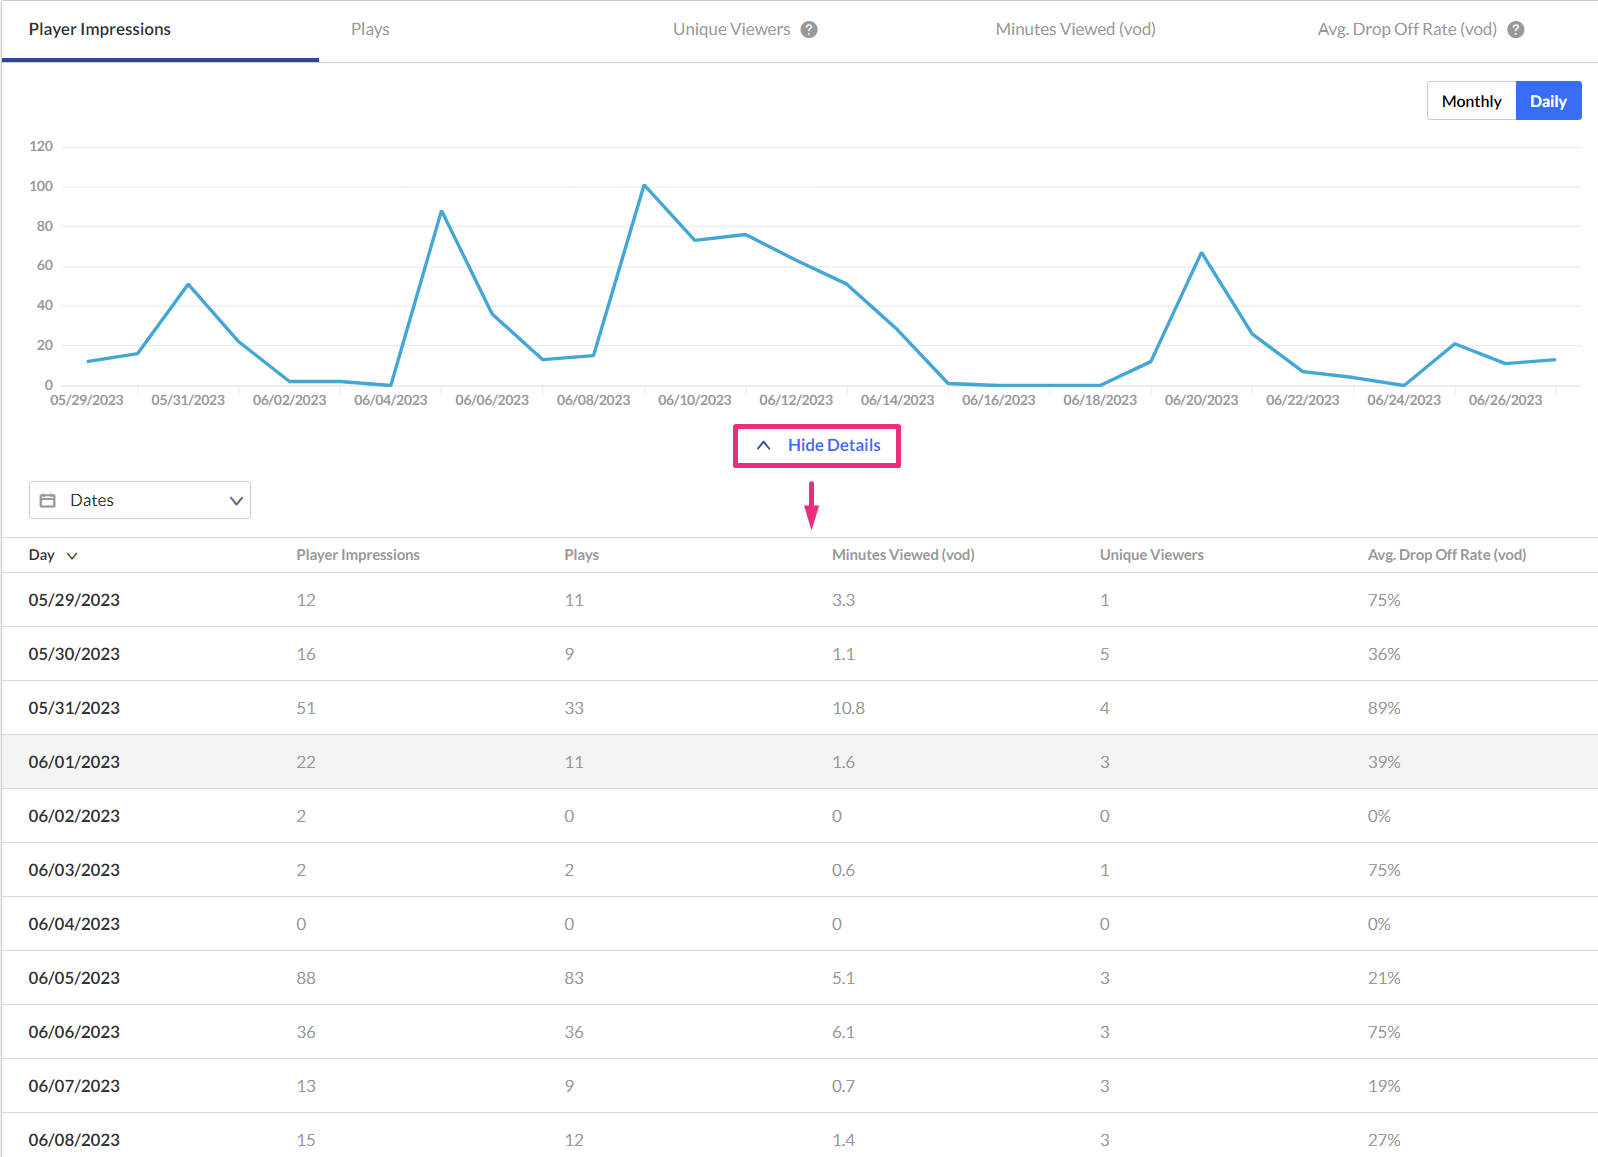
Click See Details in the Highlights or Top Videos panel to jump to the screen below the dashboard showing engagement activity.
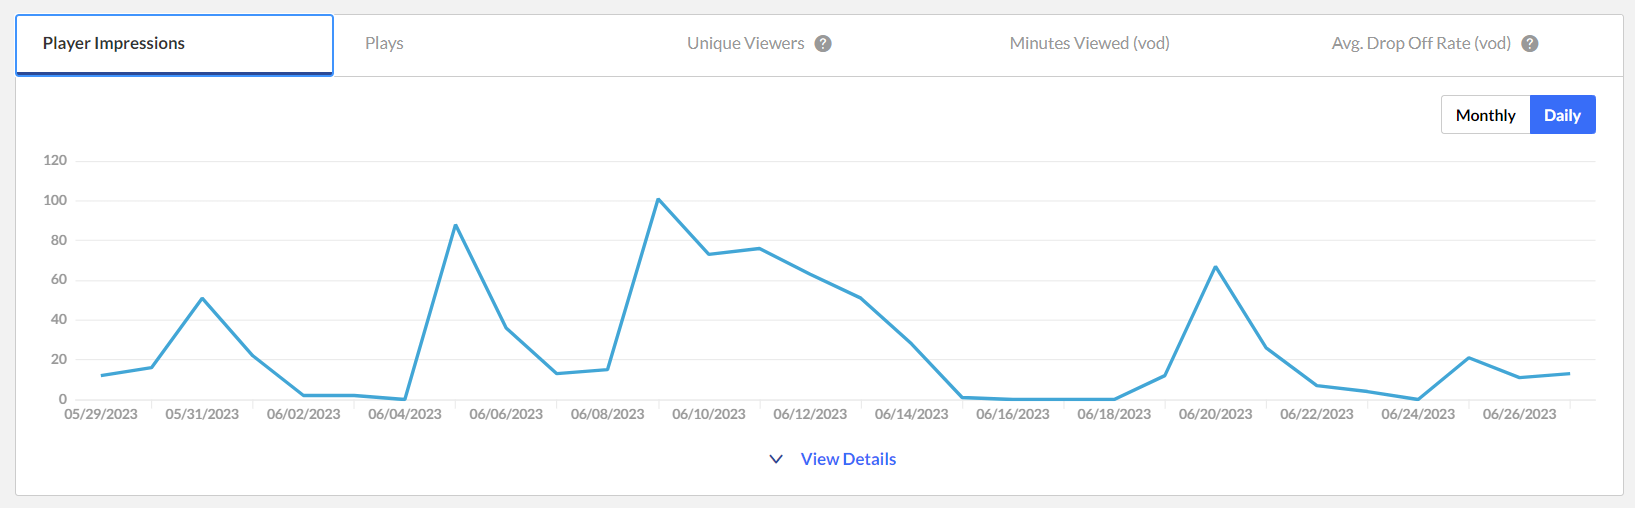
For each entry you will see:
- Player Impressions - A player impression event is counted each time the player is loaded on the page.
- Plays - A play is counted when a user clicks the Play button to watch a video. If the player is set to auto-play, a play event will be counted when the player begins to play the video.
- Minutes viewed (VOD) - Total number of playback minutes played by the viewers, based on quartile milestones. Example: If a user watched 4 minutes from a 10-minute video it will be calculated as 2.5 minutes (25% milestone).
- Unique Viewers - Number of unique users that had an active viewing action during the time period. Note that Player Impressions are not counted as a viewing action.
- Avg. Drop Off Rate (VOD) - The average percentage of drop-off quartile (last quartile watched), across all plays. Example: If a user once watched 20% of the video and the second time watched 80% of the video, the calculation will be: (0+75)/2 plays = 37.5% Avg. Drop Off Rate. 20% is calculated as 0 since the user didn’t reach the 25% milestone and 80% is calculated as 75% as the user passed the 3rd quartile milestone.
You can view the data for each metric in daily or monthly granularity.
Hover over any point in the graph to see the detailed data (as demonstrated below).
To change the time period or filter the data, use the date picker and filter panel at the top of the dashboard.
You can also compare data from different time periods. For more information, see Working with My Content Analytics Dashboard.
Click View Details to expand the screen:
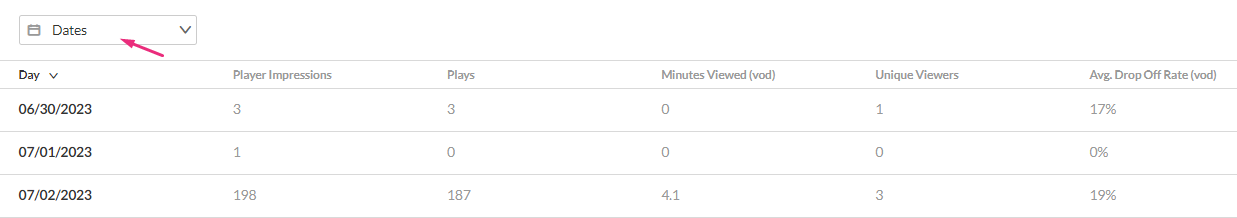
Dates
You can view the data for each metric in daily or monthly granularity. Hover over any point in the graph to see the detailed data. You can also compare to another metric by selecting another metric from the drop down list.
To change the time period or filter the data, use the date picker and filter panel at the top of the dashboard. You can also compare data from different time periods.
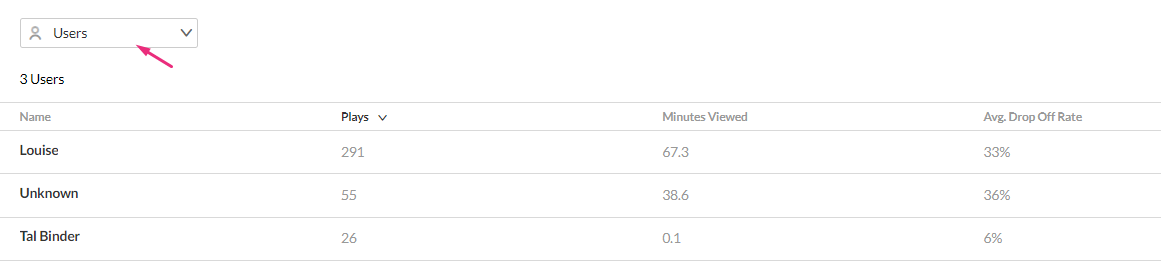
Users
Select Users from the drop down menu. A list of users and their metrics is displayed.
Entries
Select Entries to view entry analytics. Look for specific entries using the filter option.
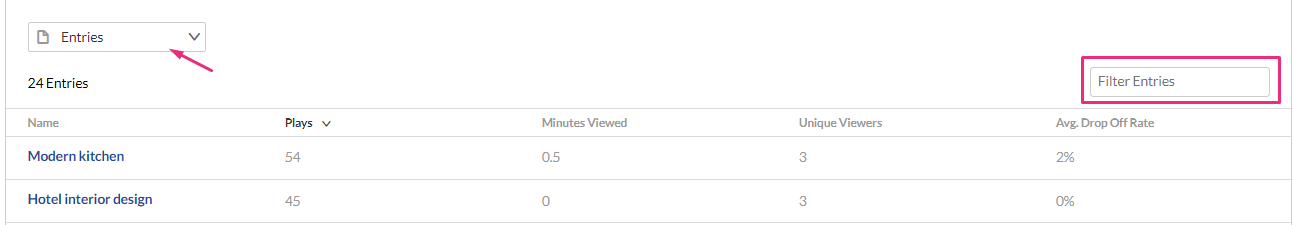
Clicking an entry will open the entry analytics dashboard where you can see how your users engage with a specific entry, where they watched it from and with what devices, so you can track and optimize your content. See our Entry analytics article for more information.
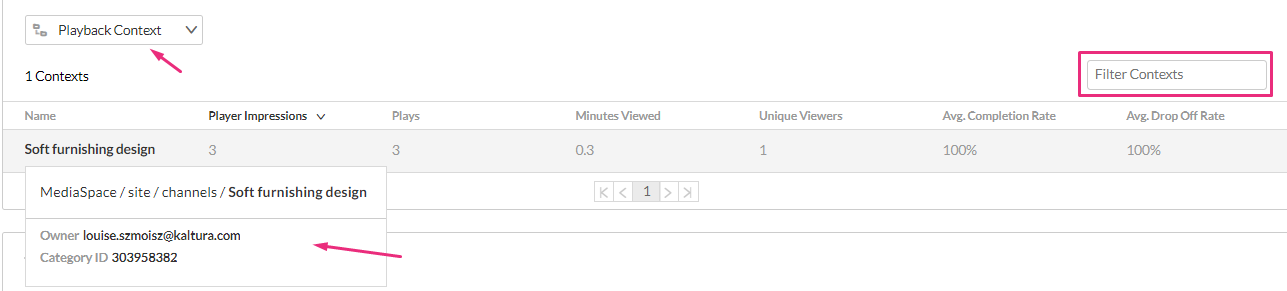
Playback Context
Playback Context refers to the place where an entry was watched, for example, from a specific channel or category. However, media might also be watched from different locations, such as shared links or embed codes. In such cases, since it was not viewed within the context of the channel or category, the Playback Context will be labeled as 'unknown'.
You can look for specific entries using the filter function. You can hover over the entry name to see details about the category, owner and ID.
Top Videos
The following information is displayed for each entry:
- Plays - Number of times the play button was pressed.
- Unique Viewers - Number of unique users that had an active viewing action during the time period. Note that Player Impressions are not counted as a viewing action.
- Average completion rate (VOD) - Average percentage of completion, across all plays.
- Score - The score is calculated by considering all three parameters - Plays, Unique Viewers and Avg. completion rate.
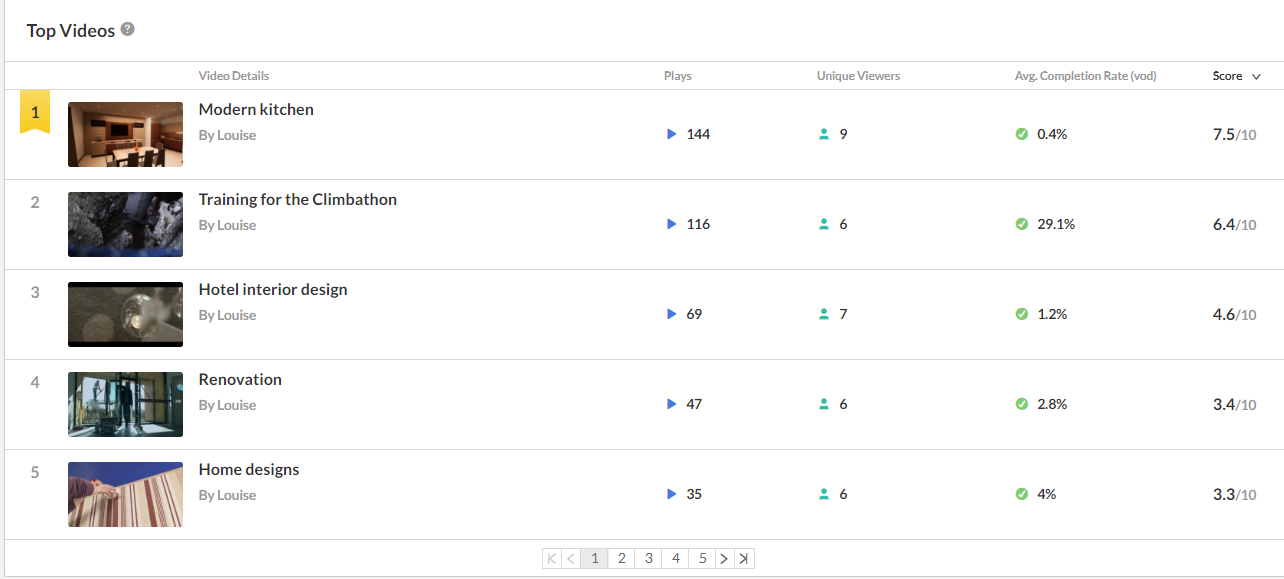
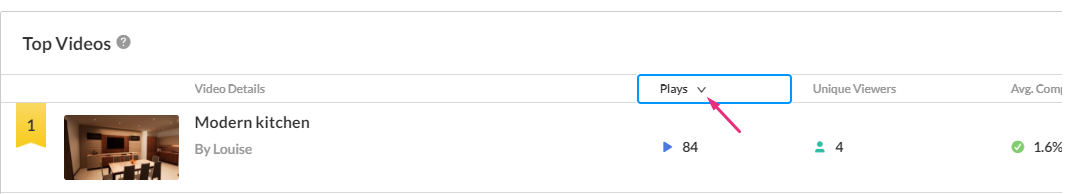
The details are displayed starting with the highest to the lowest. You can reverse the order by clicking on the arrow.
Note that deleted videos will still show up in the Analytics but without thumbnails.
Here is an example of the Top Videos dashboard showing only a blank thumbnail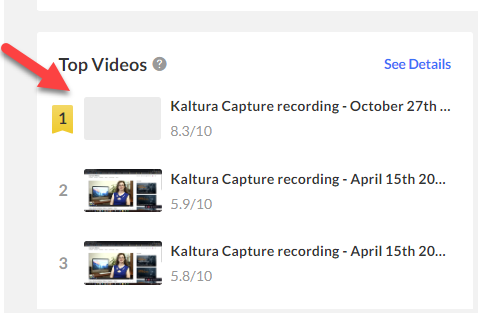 Clicking on See Details will jump to the Top Videos List where you can see that this is a Deleted entry.
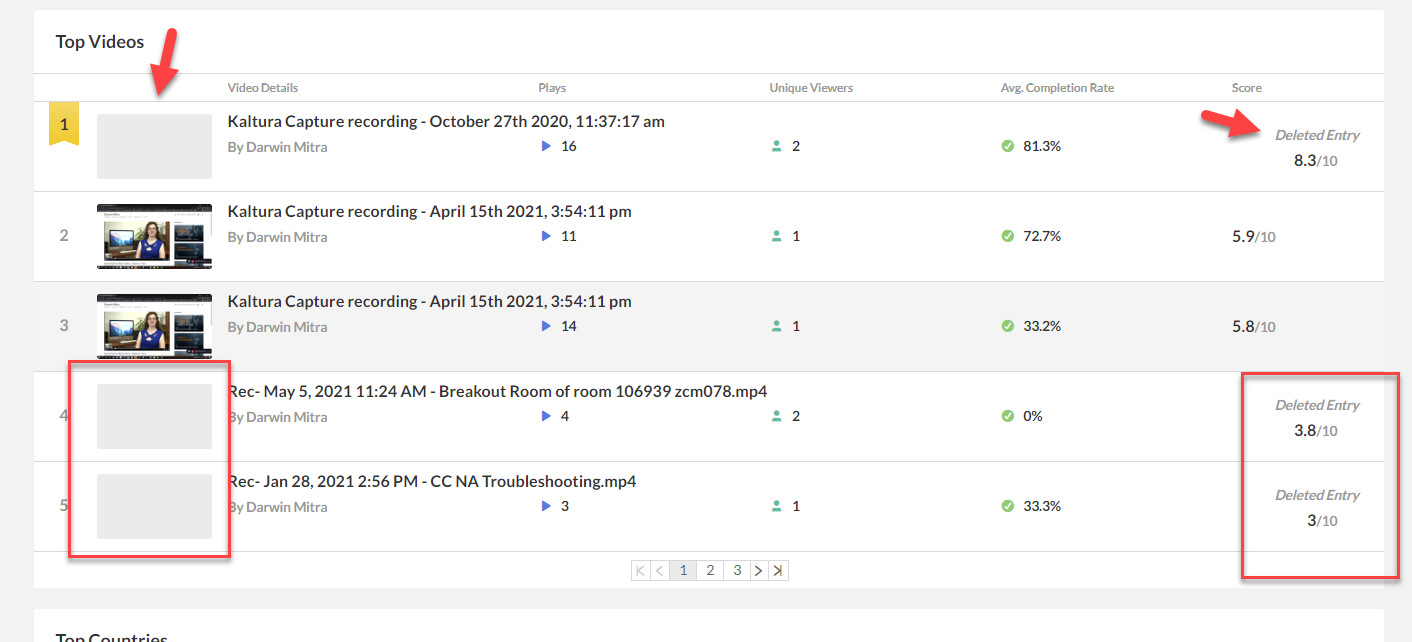
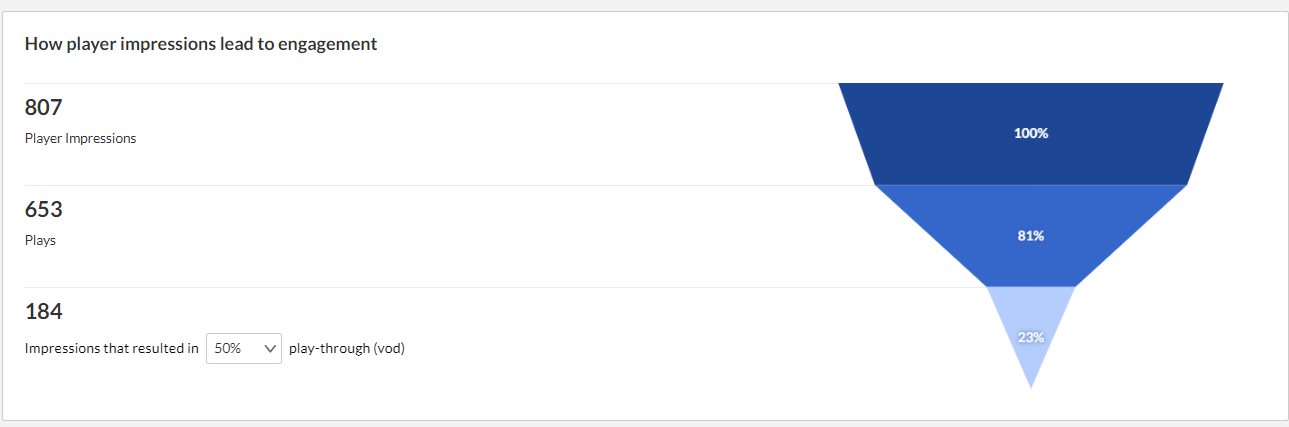
Engagement Funnel
The engagement funnel shows the viewer journey, from discovery to viewing the entire video. The following metrics are shown in the funnel:
- Player impressions - A player impression event is counted each time the player is loaded on the page.
- Plays - A play is counted when a user clicks the Play button to watch a video. If the player is set to auto-play, a play event will be counted when the player begins to play the video.
- Impressions that resulted in <x%> percent play through (VOD) - This can be selected by the user.
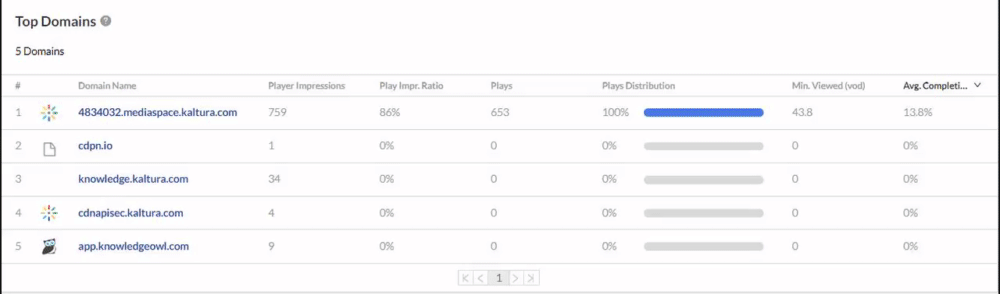
Top Domains
The top domains are arranged according to the highest number of plays in the selected time frame. For each domain the following metrics are available:
- Player Impressions - A player impression event is counted each time the player is loaded on the page.
- Player Impression Ratio - Number of plays divided by number of impressions.
- Plays - A play is counted when a user clicks the Play button to watch a video. If the player is set to auto-play, a play event will be counted when the player begins to play the video.
- Plays Distribution - Number of plays divided by the total number of plays in the selected timeframe.
- Minutes viewed (VOD) - Total number of playback minutes played by the viewers, based on quartile milestones. Example: If a user watched 4 minutes from a 10-minute video it will be calculated as 2.5 minutes (25% milestone).
- Average Completion Rate (VOD) - Average percentage of completion, across all plays. Example: If a user once watched 20% of the video and the second time watched 80% of the video, the calculation will be: (20+80)/2 plays = 50% Avg. Completion Rate.
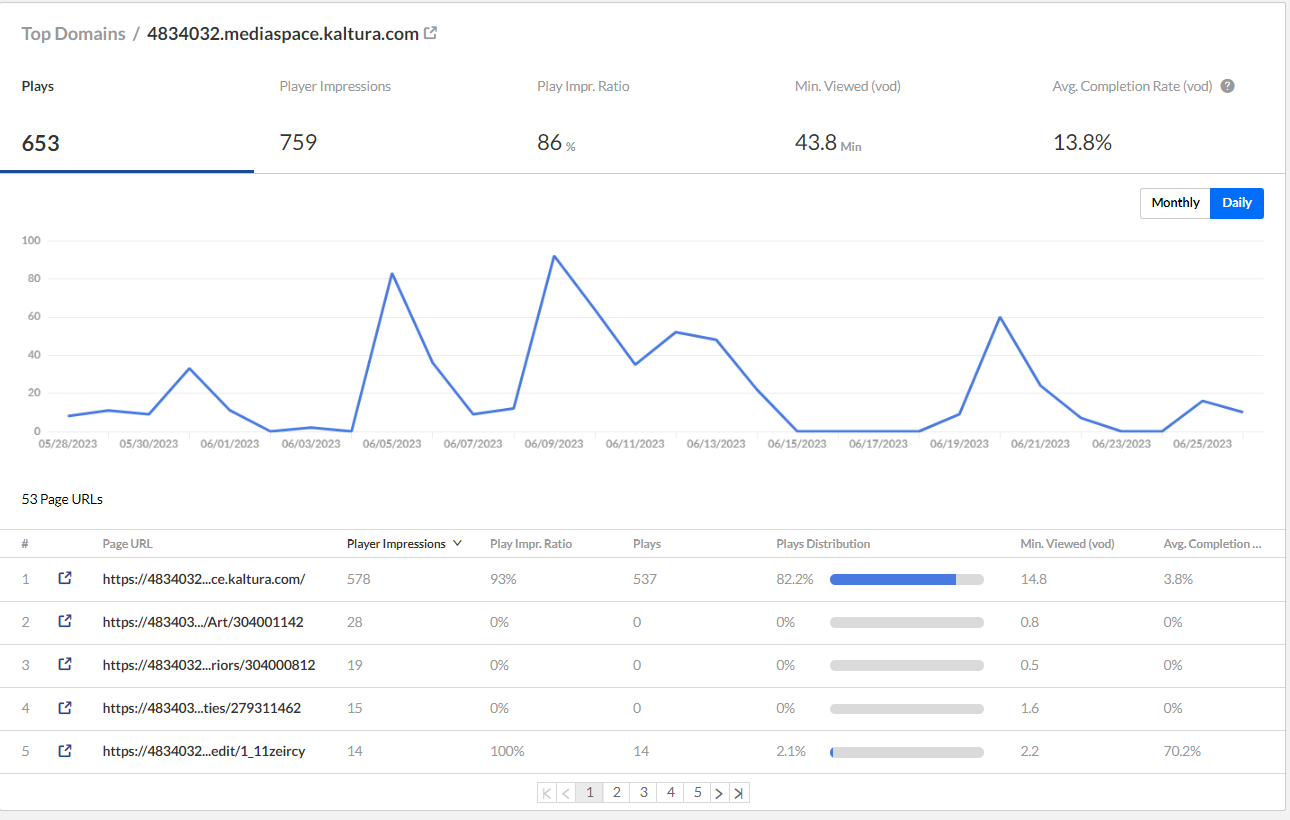
You can also drill down to a specific domain to see all the URLs under that domain and the same metrics in a more granular view. You can view the data for each metric in daily or monthly granularity. Hover over any point in the graph to see the detailed data. Click on the title of the metric in the table to sort the table based on this metric.
Please note that privacy or ad-blocking software may cause potential issues when collecting Kaltura analytics. To address this, try allowing Kaltura domains and removing Kaltura-related sites from your firewall settings or filters.
For the Administrator's guide, visit our article My Analytics - Admin.